Understanding the graphs
Eye Precision and EP Animations give graphs in different forms. Theset forms will be described here.
Eye Precision
Eye Precision displays results in its own results view. The video is displayed at the top, with 2 graphs underneath
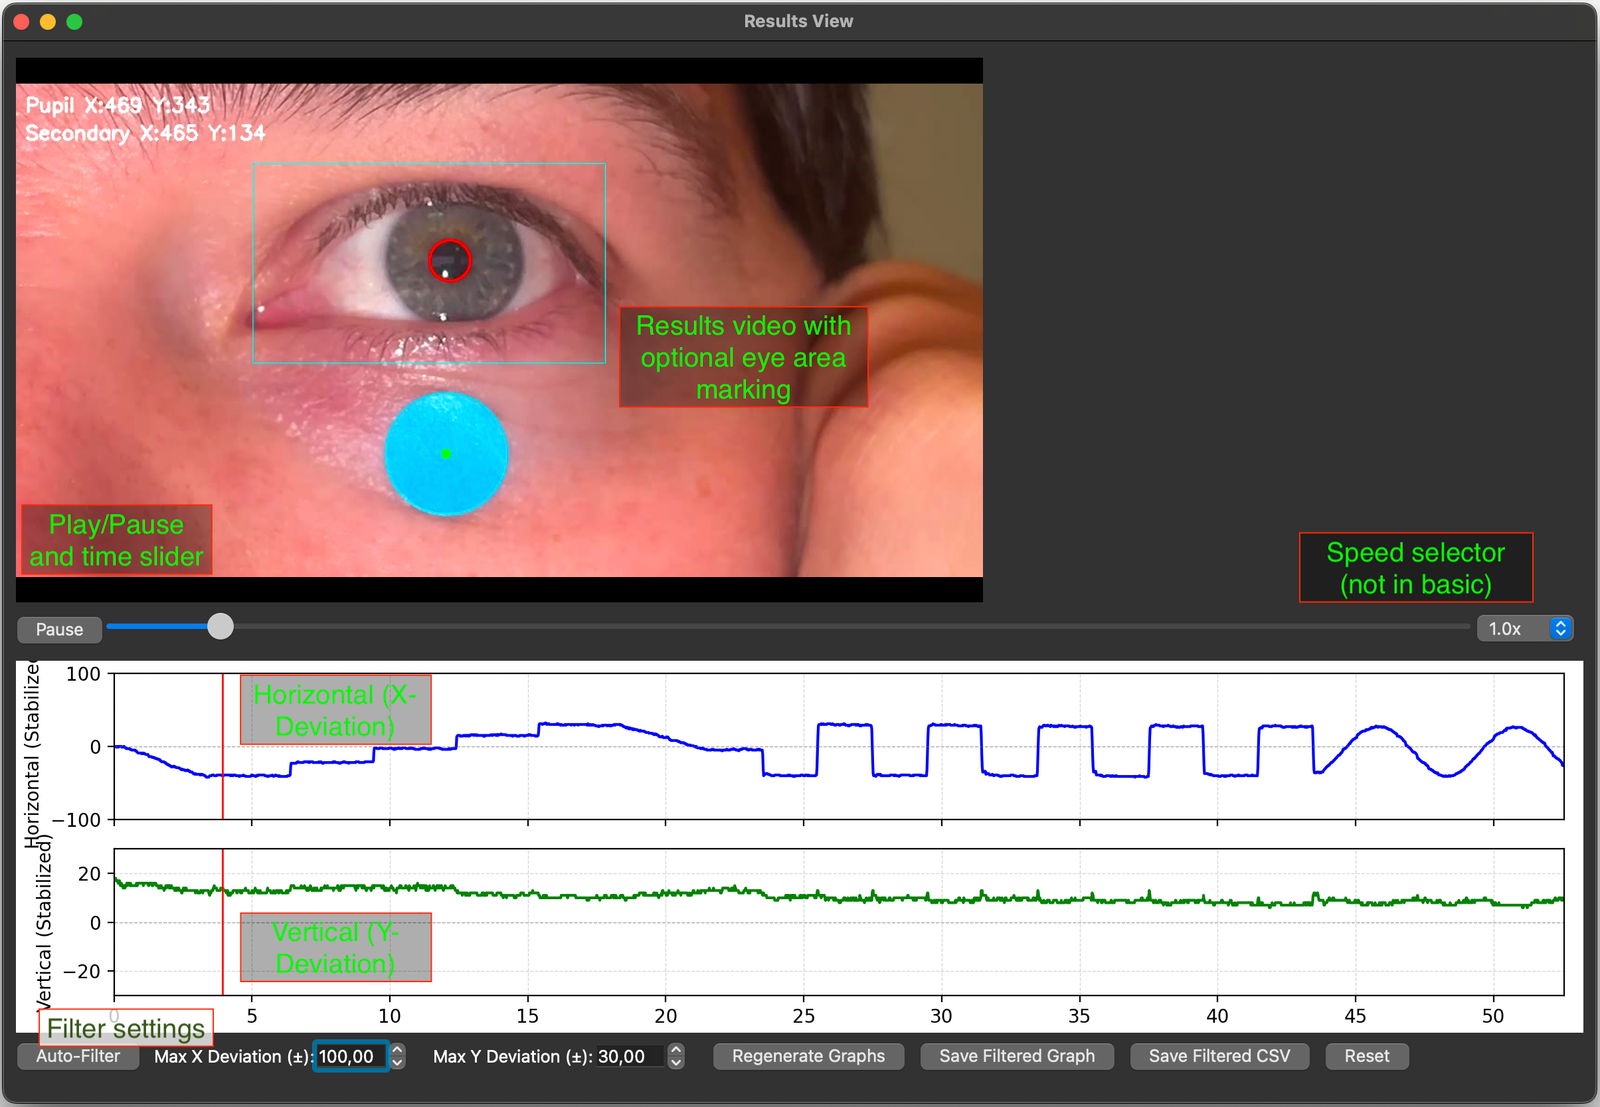
When the video plays, a red marker moves along the graph plots, showing the time of the video on the graph.
The top plot shows horizontal deviation at any given time - upwards is a leftward movement of the pupil on the video frame, which corresponds to a rightward movement of the eye, and vice-versa.
The bottom plot is vertical deviation, so up is up and down in down
Both graphs show time on the X-axis, increasing linearly from left to right
This is an example of the graphs output to a saved folder, showing nystagmus generated by Optokinteic stimulation:
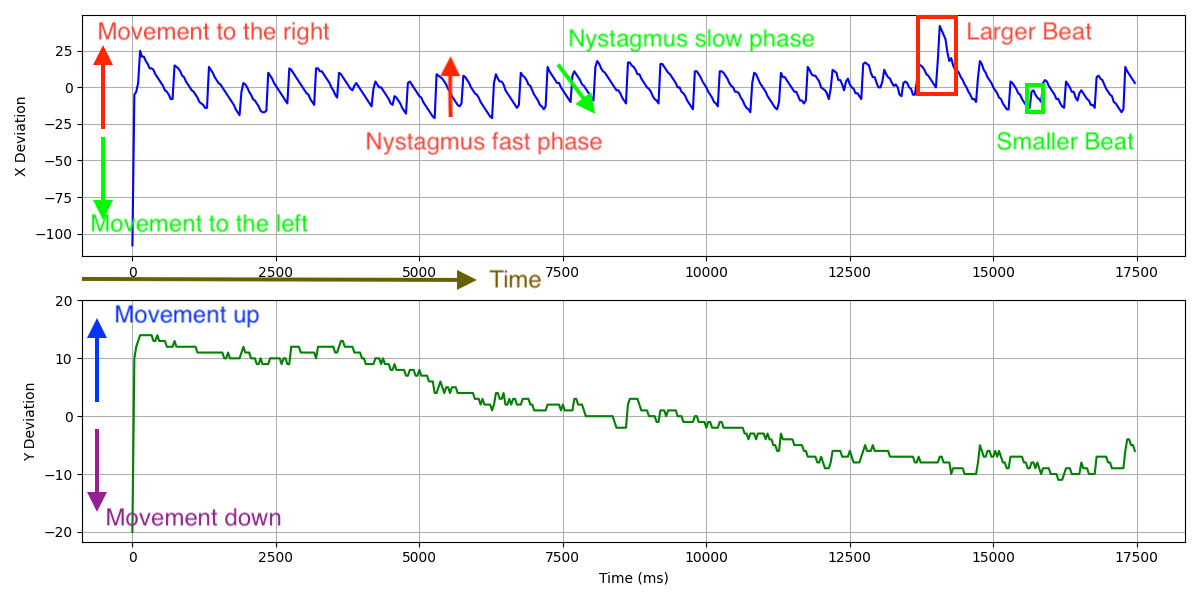
Fast-phases are recognised by pratically vertical lines, showing a very quick transition from one location to another. Slow phases are displayed as a more gradual slope, as the movement of the eye was took more time
The height/length of a line (vertical or sloped) shows the amplitude of the movement recorded - a longer continuous line in any direction indicated a greater amplitude
On the Y-deviation graph we see a gradual downward slope from start to finish, most likely indicating that the test subjects head moved gradually during testing
Almost all graphs will show some amount of noise, particularly at smaller scales (note the difference in the scale of the Y-axis in the X-deviation graph vs the Y-deviation graph)
EP Animations
EP animations results graphs come in two forms of their own - the basic output, and the interactive graph.
A standard output graph from a video of large saccades and fast sinusoidal pursuits, recorded on a smartphone:
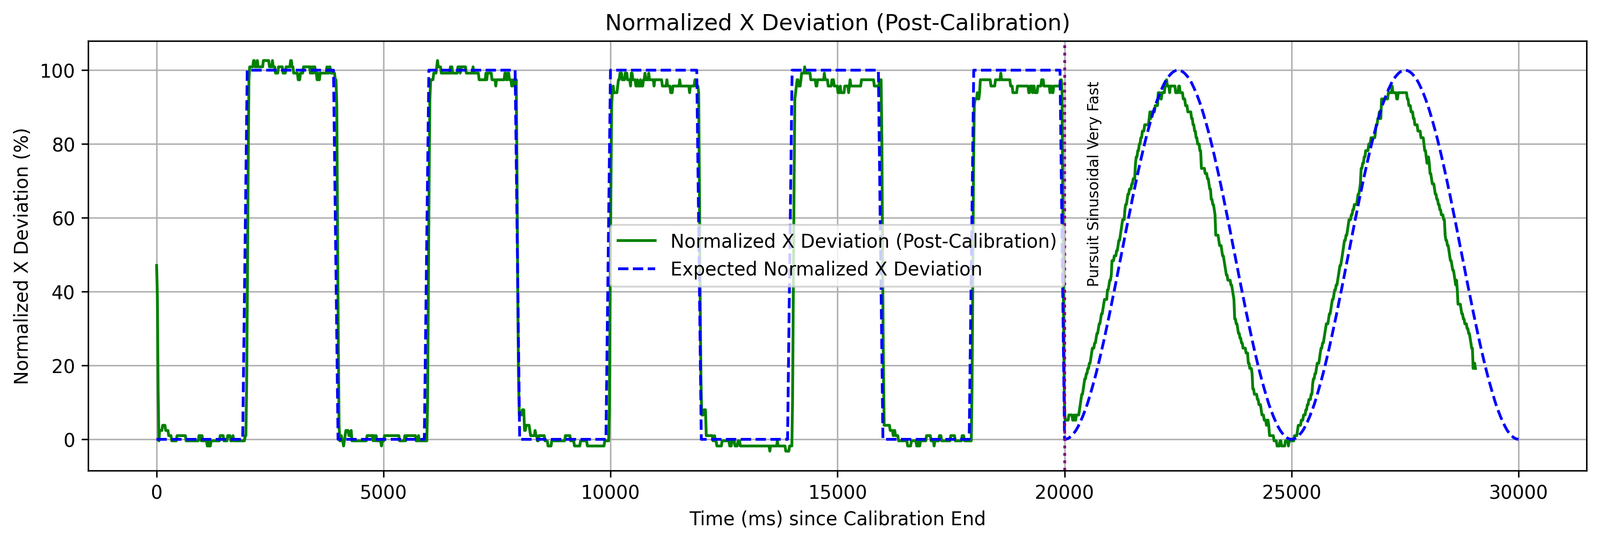
The are 2 separate lines plotted on the same graph - the green line show the measured position of the pupil, while the blue dotted line shows the expected position of the pupil based on the animation being analysed
Depending on the type of test being performed (horizontal or vertical), an upward line indicates either a rightward or upward movement of the eye, and vice-versa
The actual pupil position is calibrated in EP Animations, to give an accurate comparison to the position of the animated dot on the screen. Any head movement will cause a shift of this alignment
Without a calibration phase of the recording, this type of graph cannot be generated
Once again, time is displayed linearly on the x-axis
The following is a part of an interactive graph of saccades, saved as a png
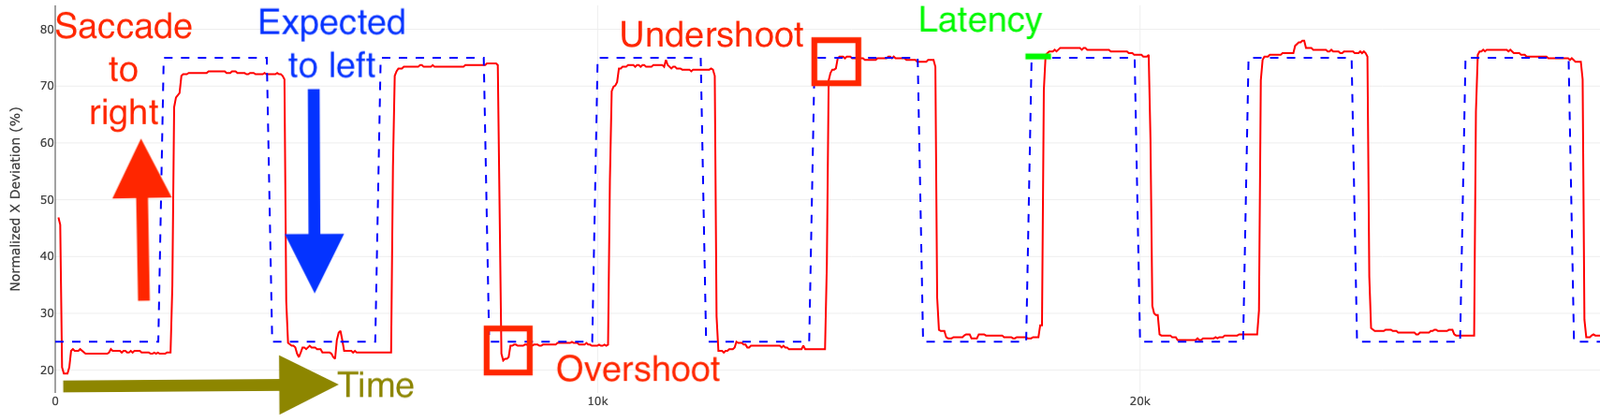
Interactive graphs open in the browser, but no data is uploaded to the internet
Time and deviation can be offset using sliders to give a more accurate represenation on the graph, correcting for head movement or incorrect start times
The above graph was saved to disc using the "Save Graph" button on the bottom left of the browser window
Again, depending on the type of test being performed (horizontal or vertical), an upward line indicates either a rightward or upward movement of the eye, and vice-versa, while time is displayed on the x-axis