Step-by-Step guide to the Eye Precision Animations and Analysis app
The Animations app provides standardized animations and analyses the Eye Precision tracking results to comparison graphs
For installation instructions go to this page and choose your operating system
To skip to data analysis instructions click here
Open the EP Animations App
On Windows the program should be found in your Start Menu, on Mac it should be in your Applications folder and/or your Launchpad
I recommend pinning the menu icon to the taskbar to allow quick access to the program
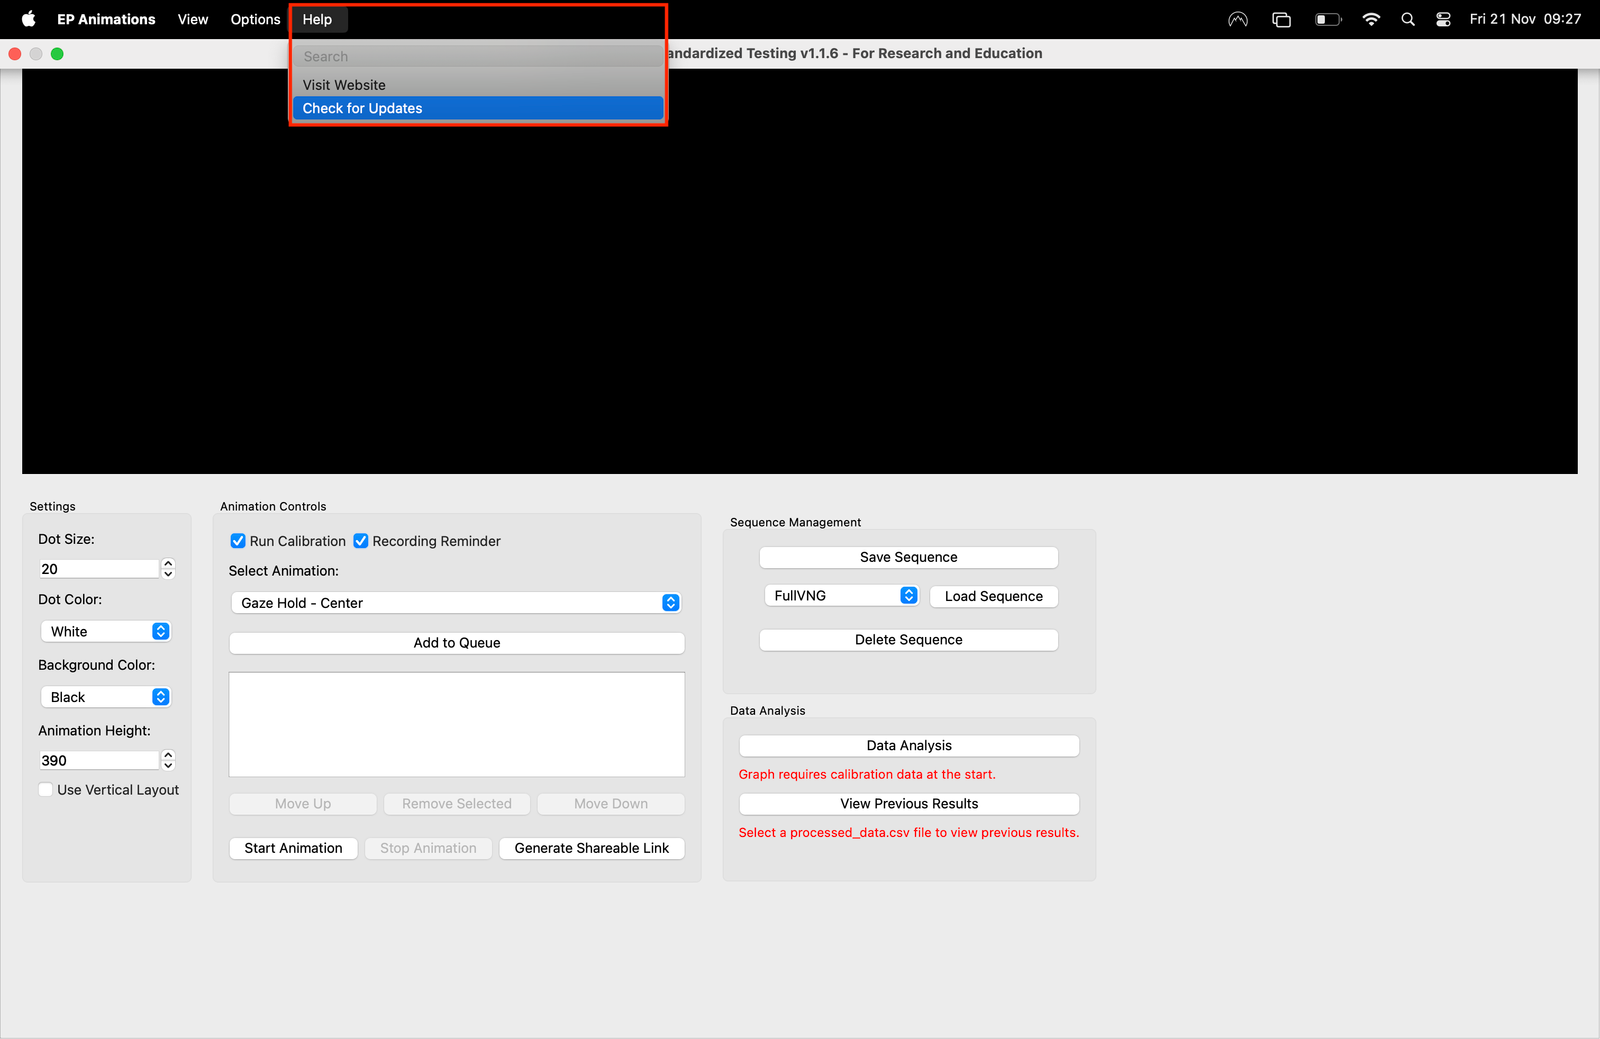
Check for Updates
The EP Animations receives regular updates. Make sure you're using the latest version by clicking on "Help" in the menu bar (at the top of the screen on Mac, at the top of the program window in Windows) and choosing "Check for Updates"
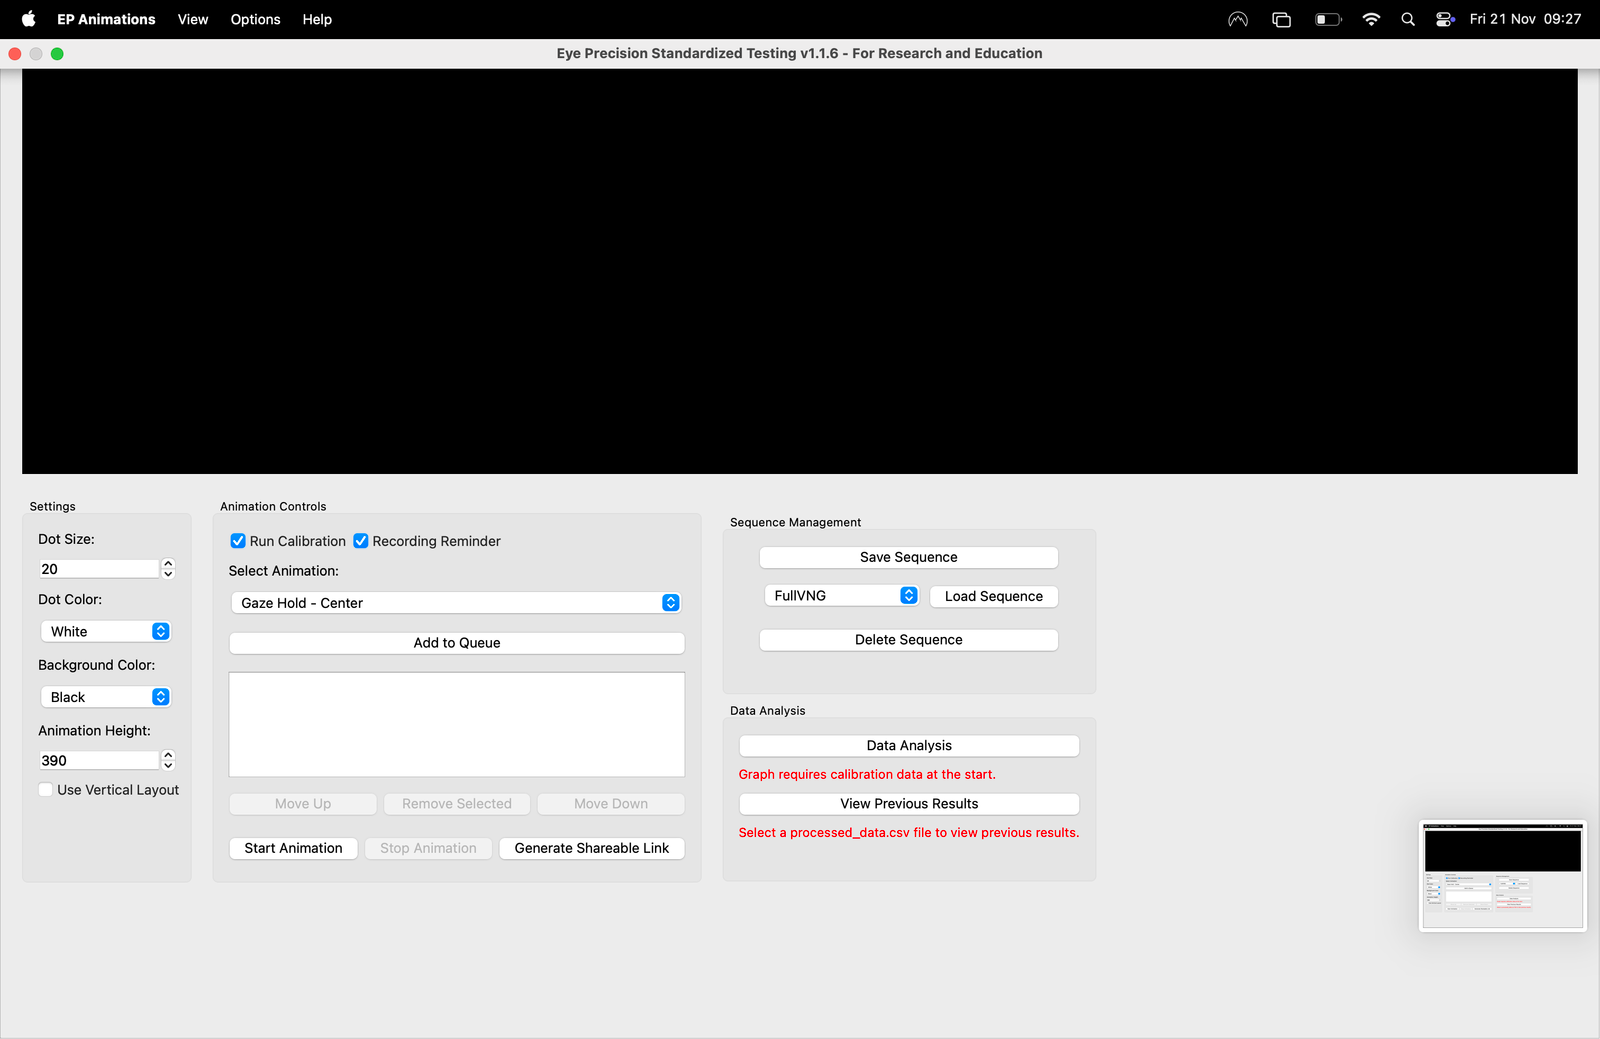
Choose animation display settings
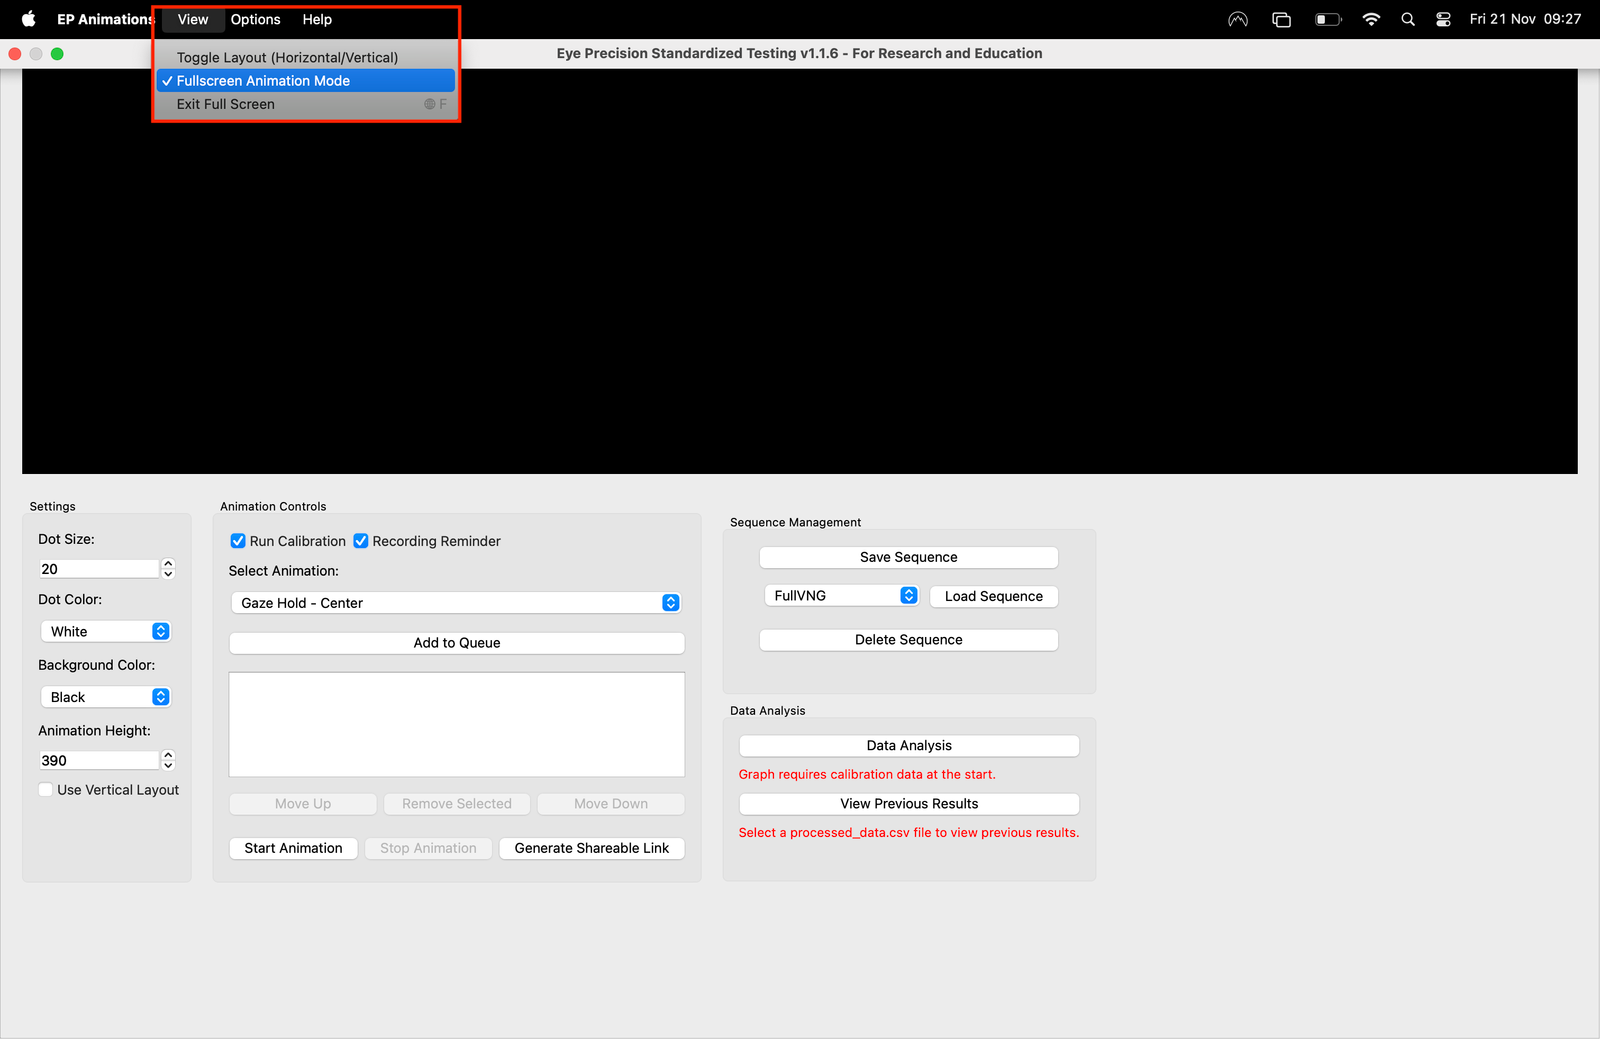
The animation sequences can be run in the Animation Canvas area in the main program window, or in full screen. Toggle between the two options in the menu bar under "View"
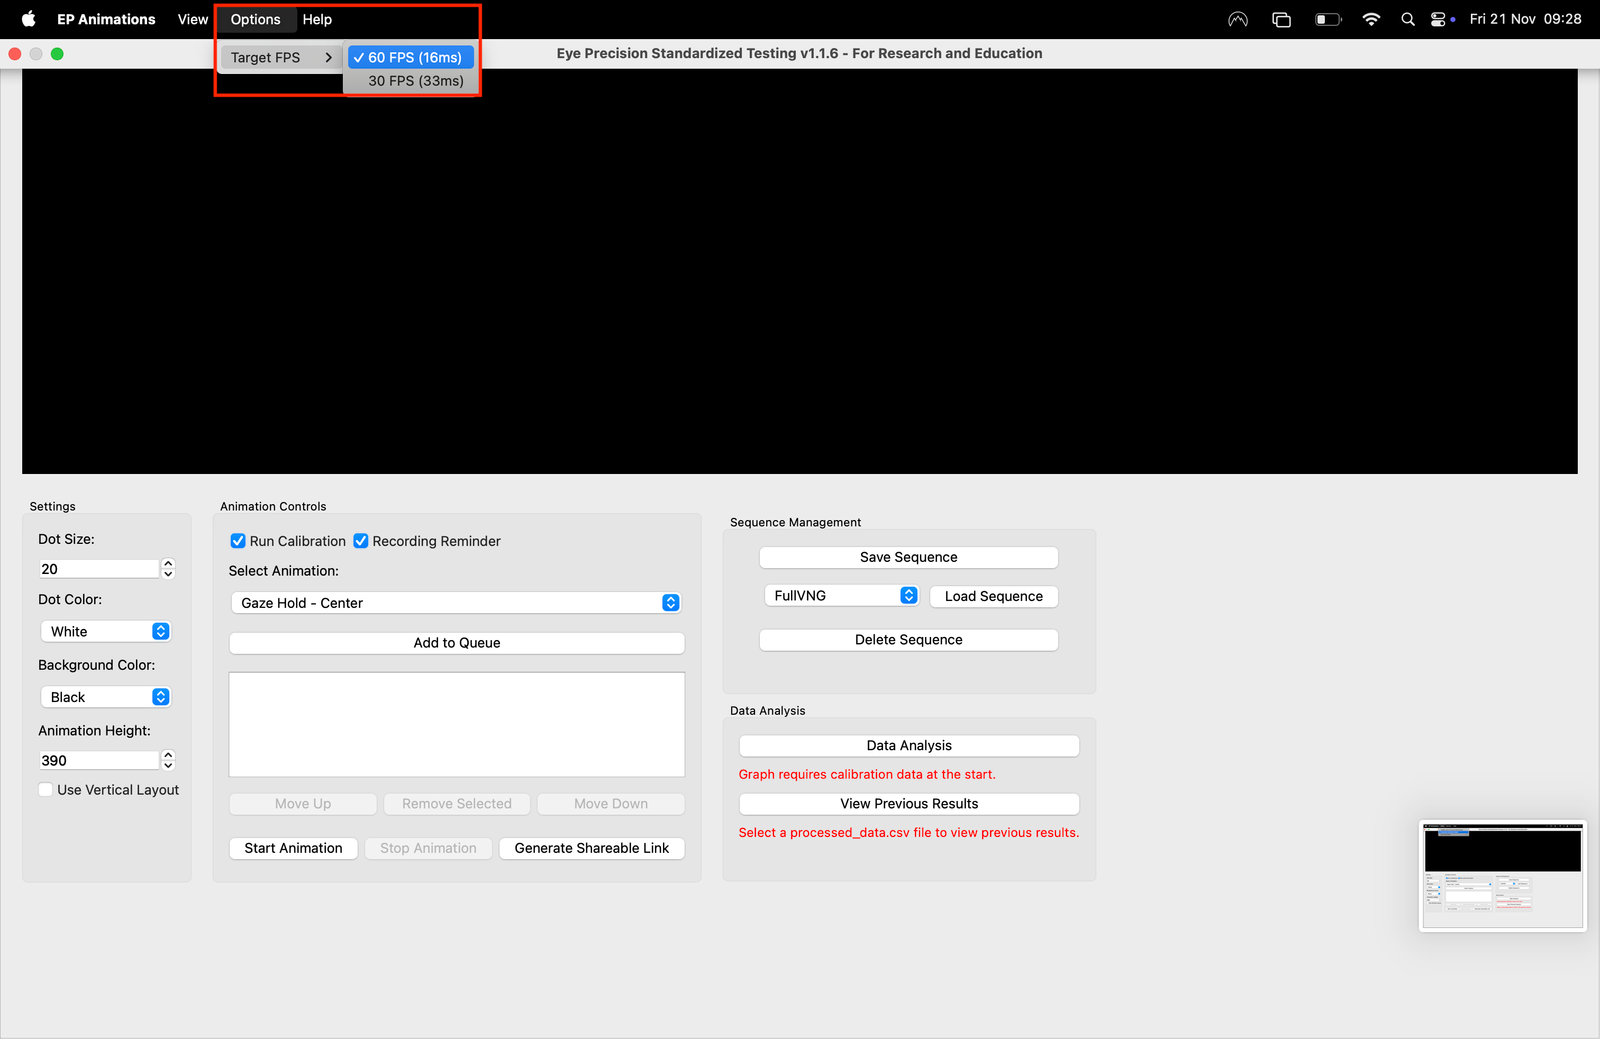
You can choose between 30 or 60 frames per second for the animations, depending on your computers speed and your screen
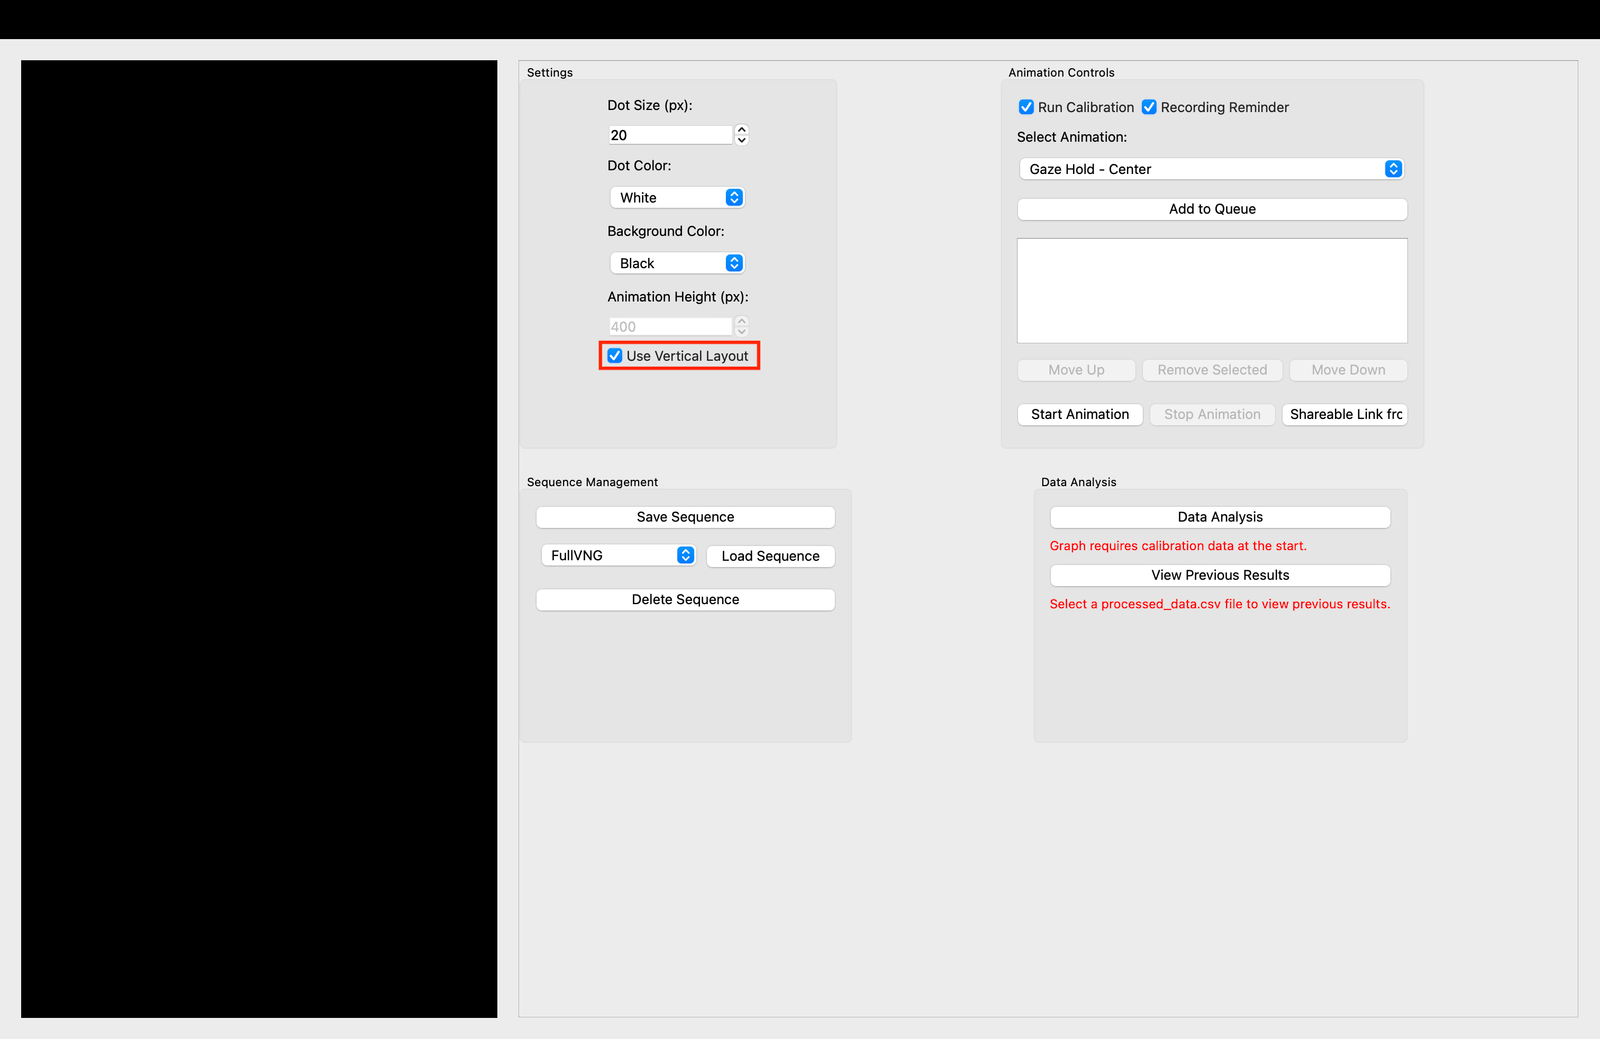
Choose Horizontal or Vertical mode
All animations can be run vertically or horizontally, but due to calibration restrictions they cannot be mixed. You can switch between horizontal and vertical mode in the menu bar, or by clicking the "User Vertical Layout" toggle
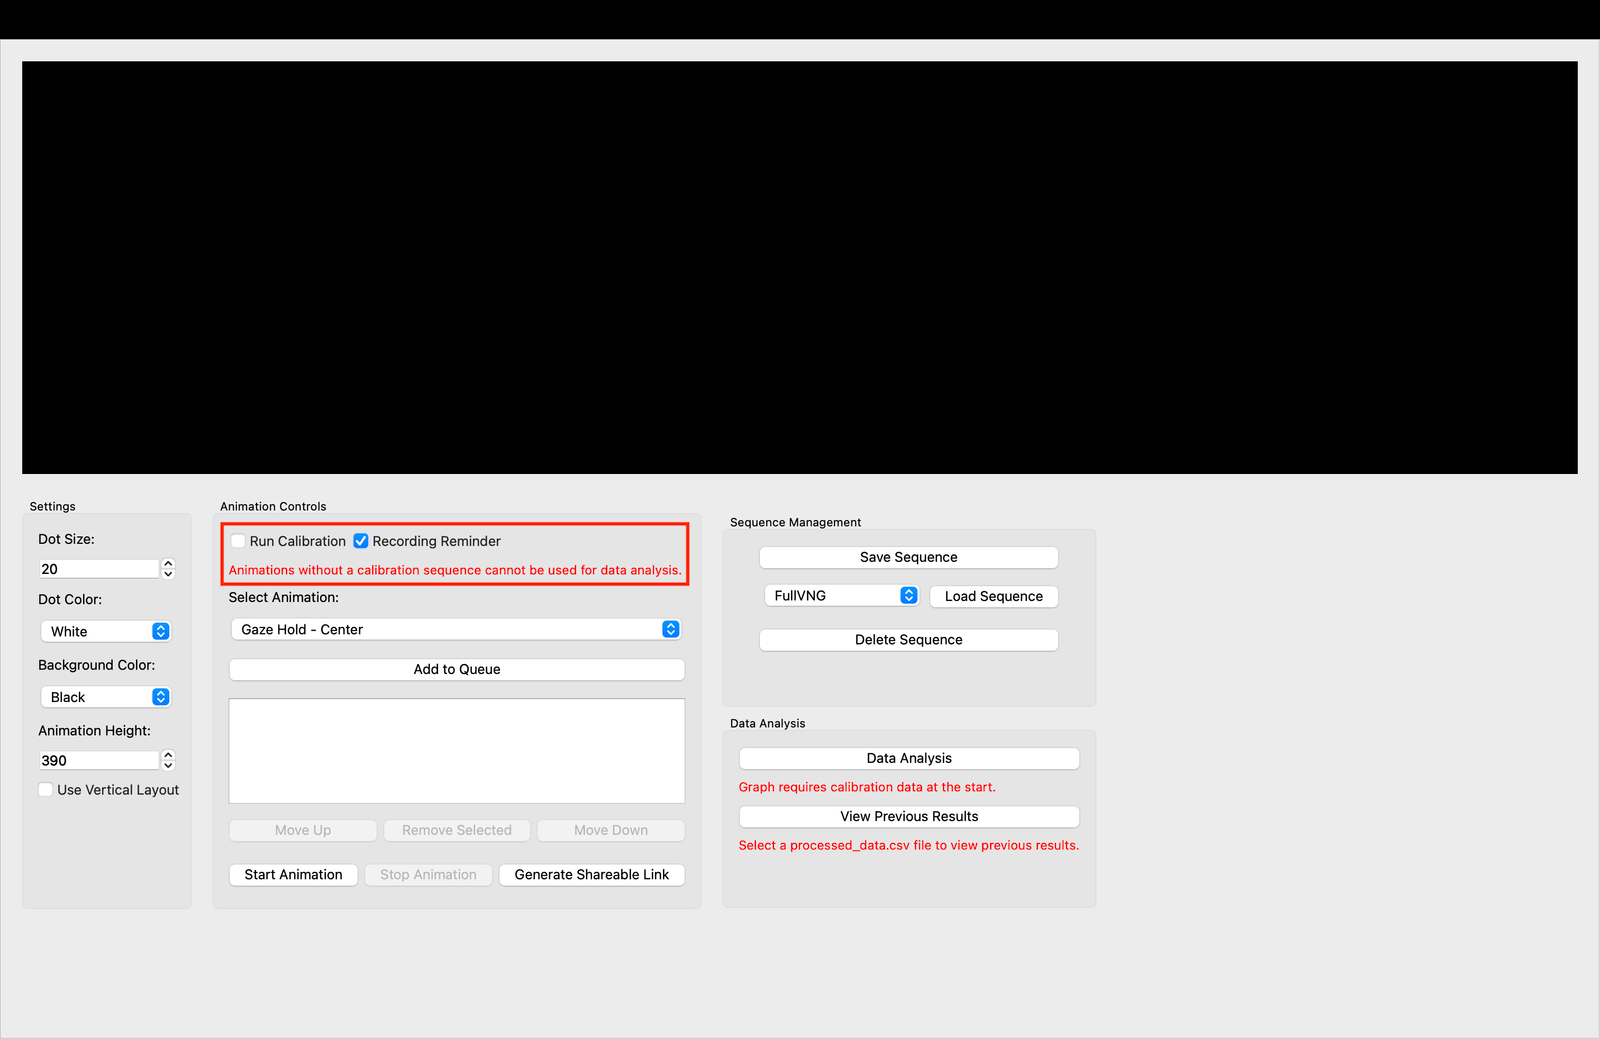
Use calibration if you intend to use Data Analysis
To provide comparison graphs of Eye Postion vs Target Position you must run a calibration sequence at the start of the test. This is a standardised sequence that allows the software to measure relative eye positions
Without first running a calibration sequence the comparitive graphs cannot be generated
Encourage the test subject not to blink during the calibration sequence for the best results. If the test subject cannot sufficiently focus on the visual target calibration may fail and the comparitive graphs may not provide useful information
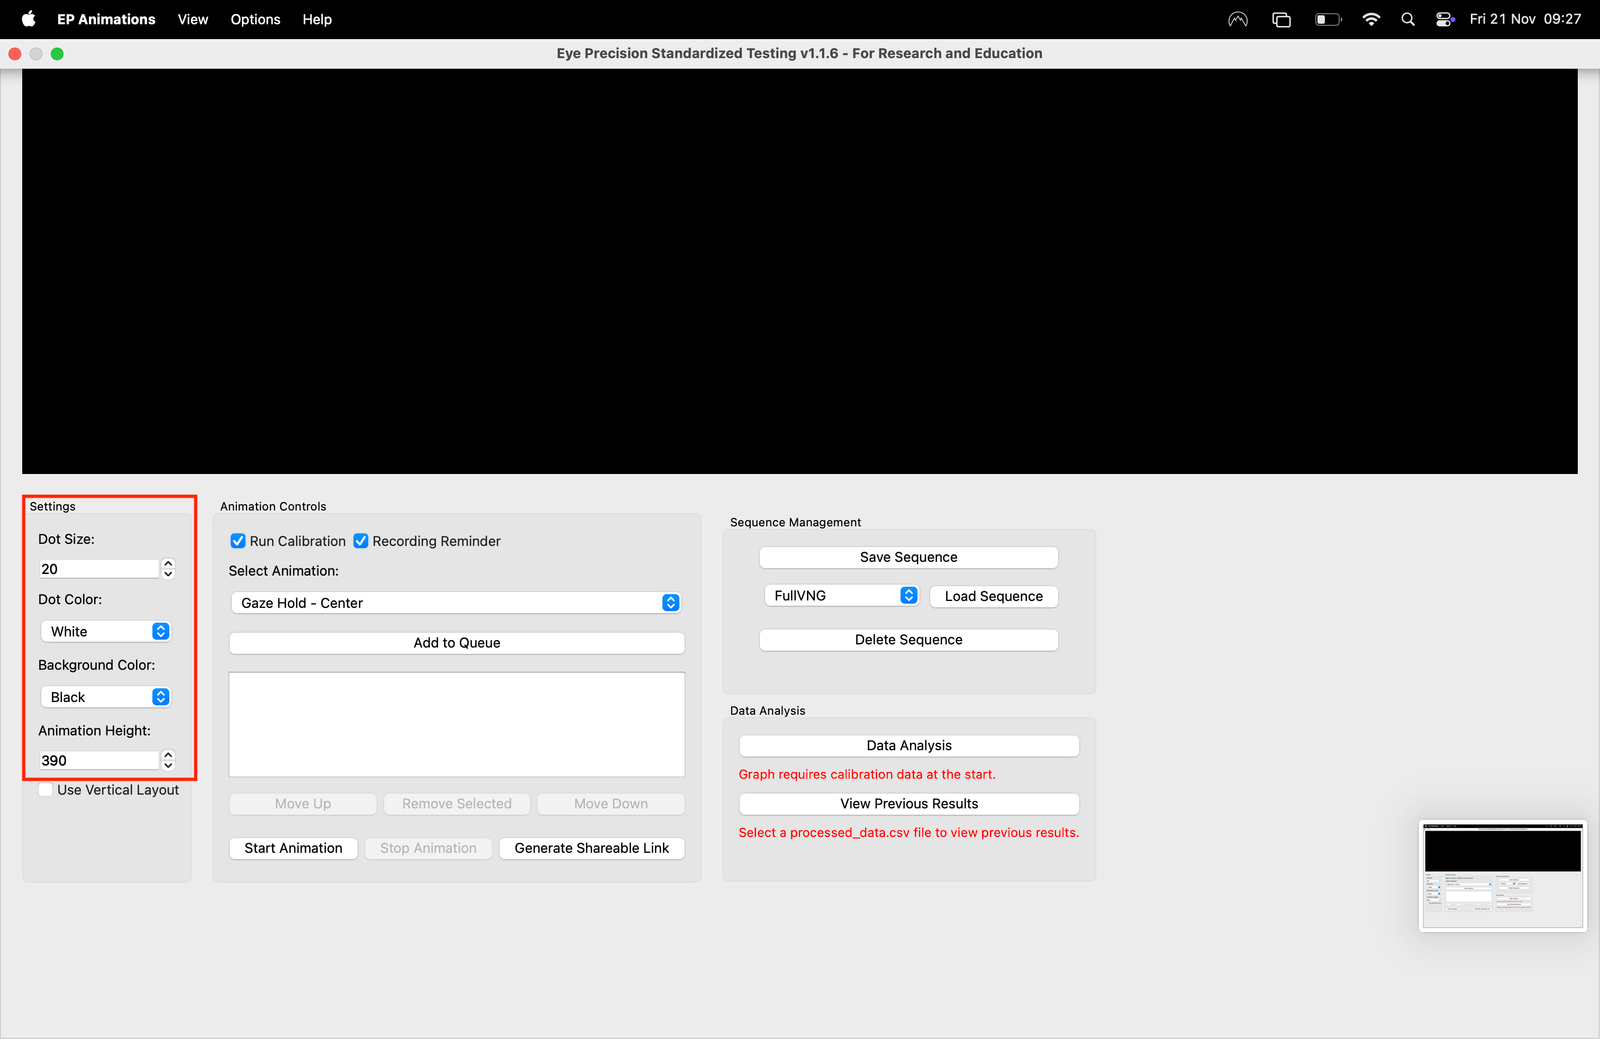
Set the animation parameters
The visual target and the background on which it runs are set in the "Settings" panel
If you'd like different option please contact support@eyeprecision.com and I'll try to make it happen
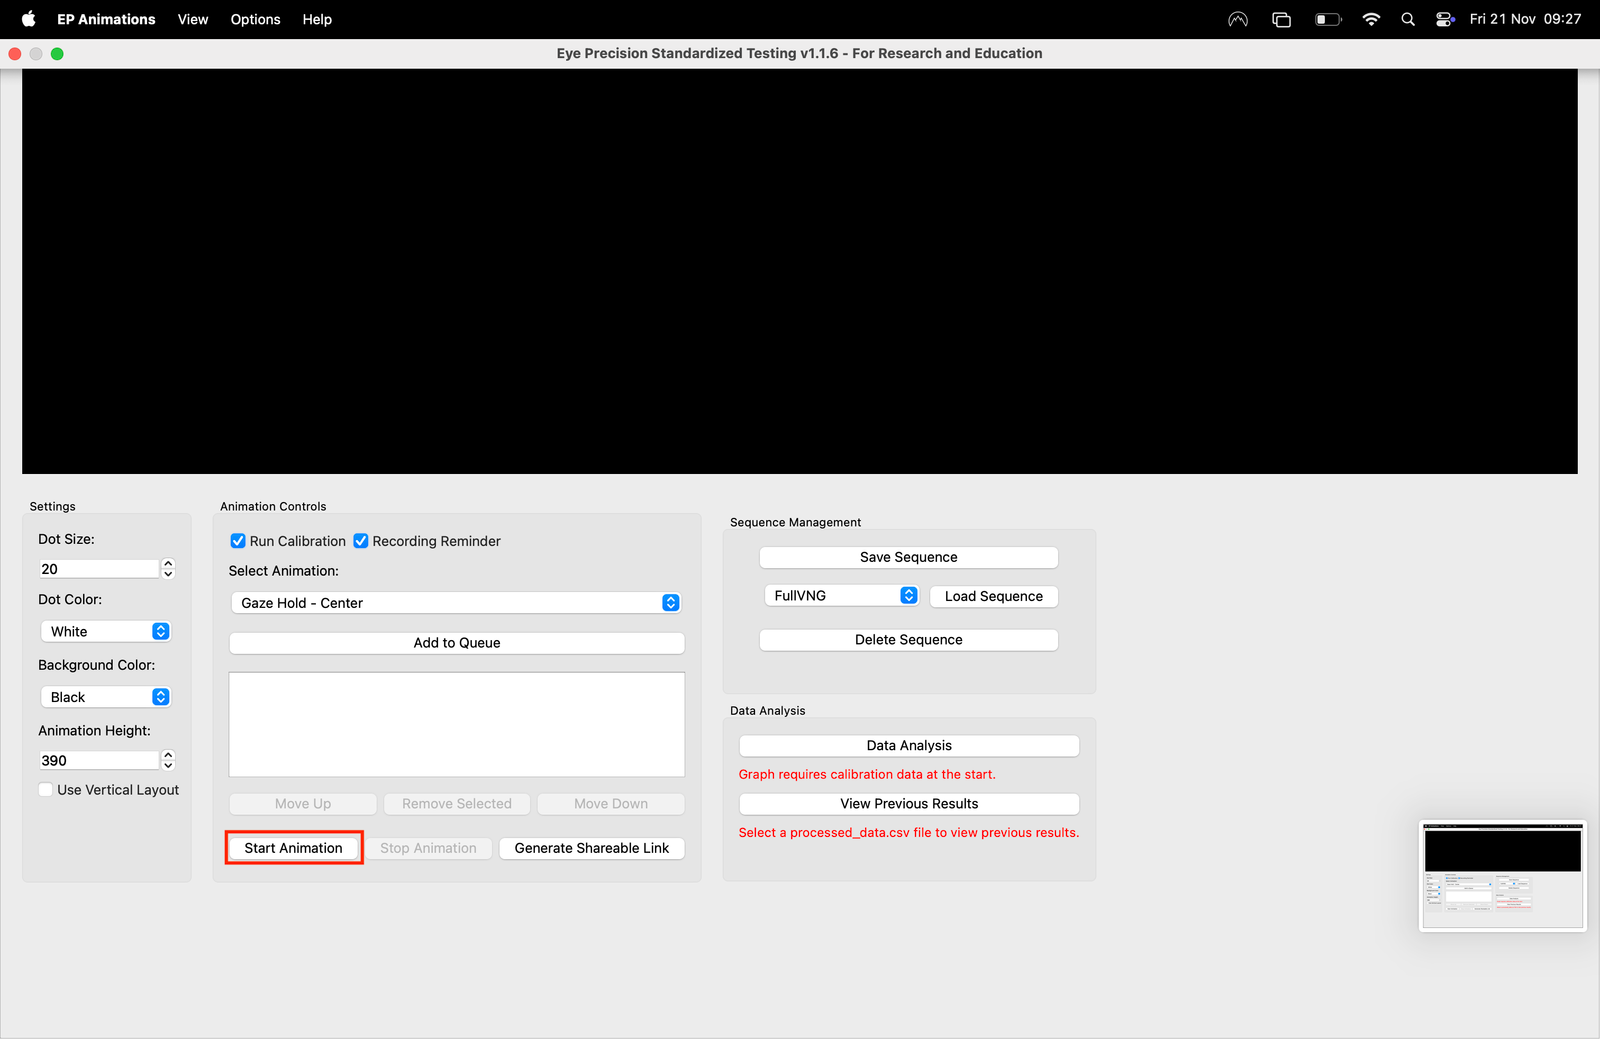
Choose the animations you want to run
Animation sequences are entirely customisable. Choose the animations that you want to run for the testing from the dropdown list
Click on "Add to Queue" to add the animation to the list of animations to be played
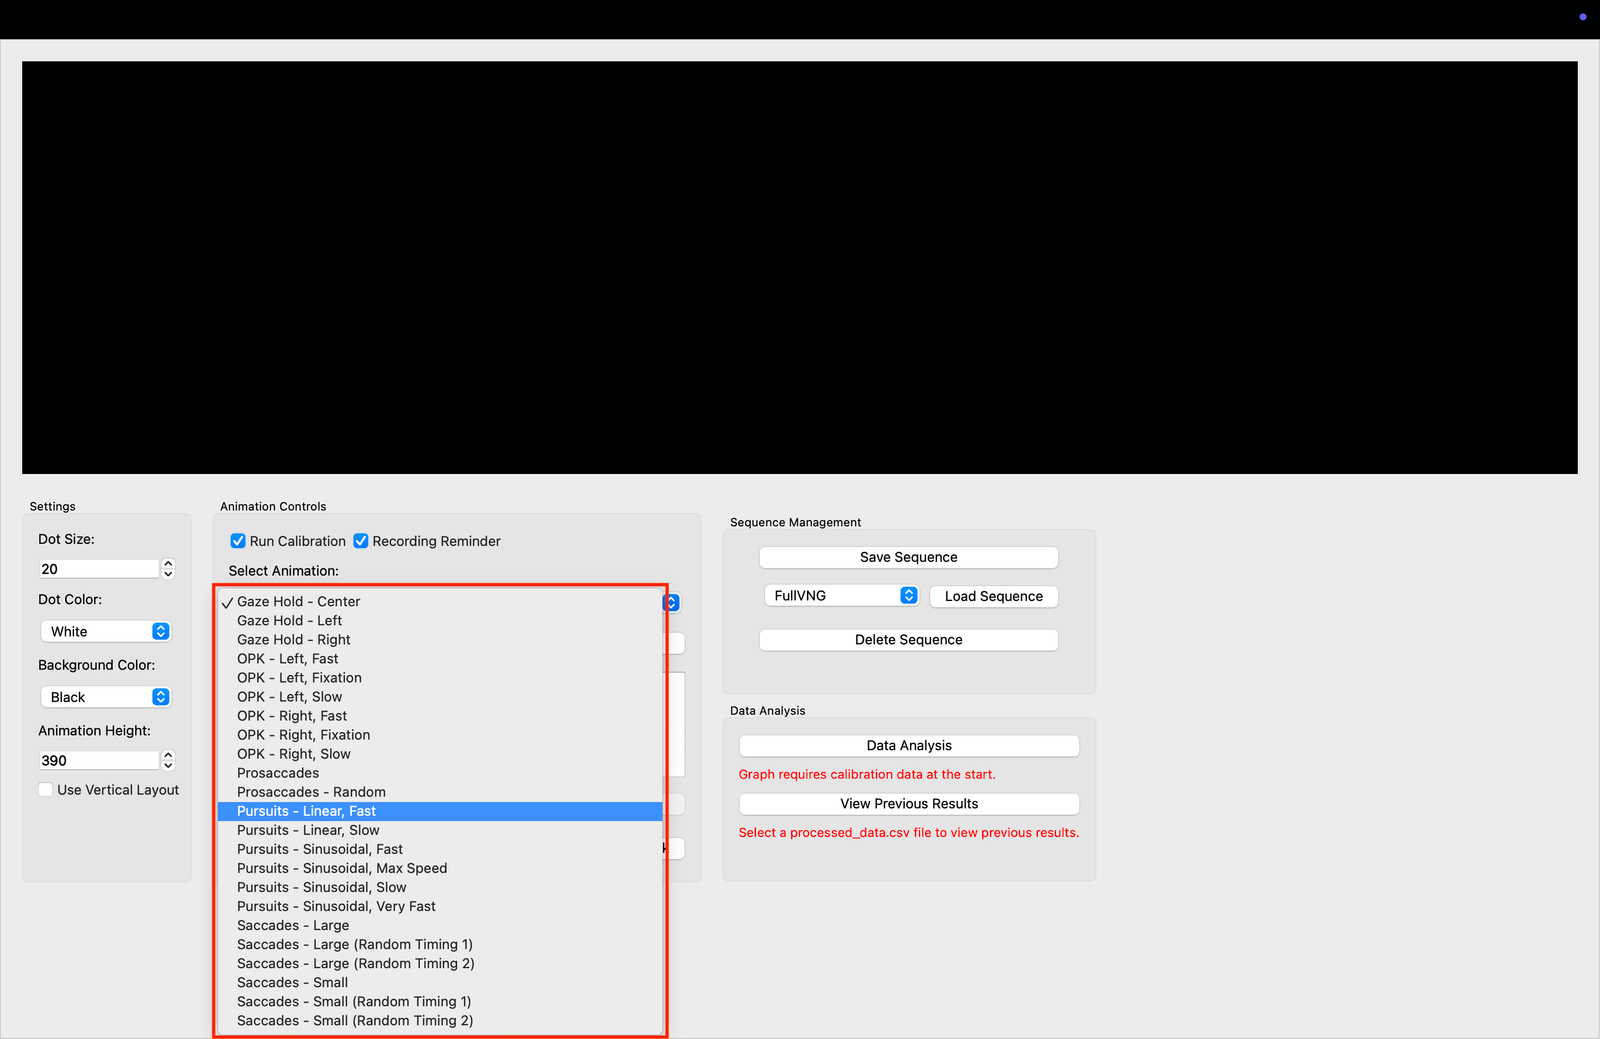
Each animation can be added any number of times
If calibration is selected it will be played automatically at the start of the animation queue
Change the calibration queue using the buttons underneath the queue list
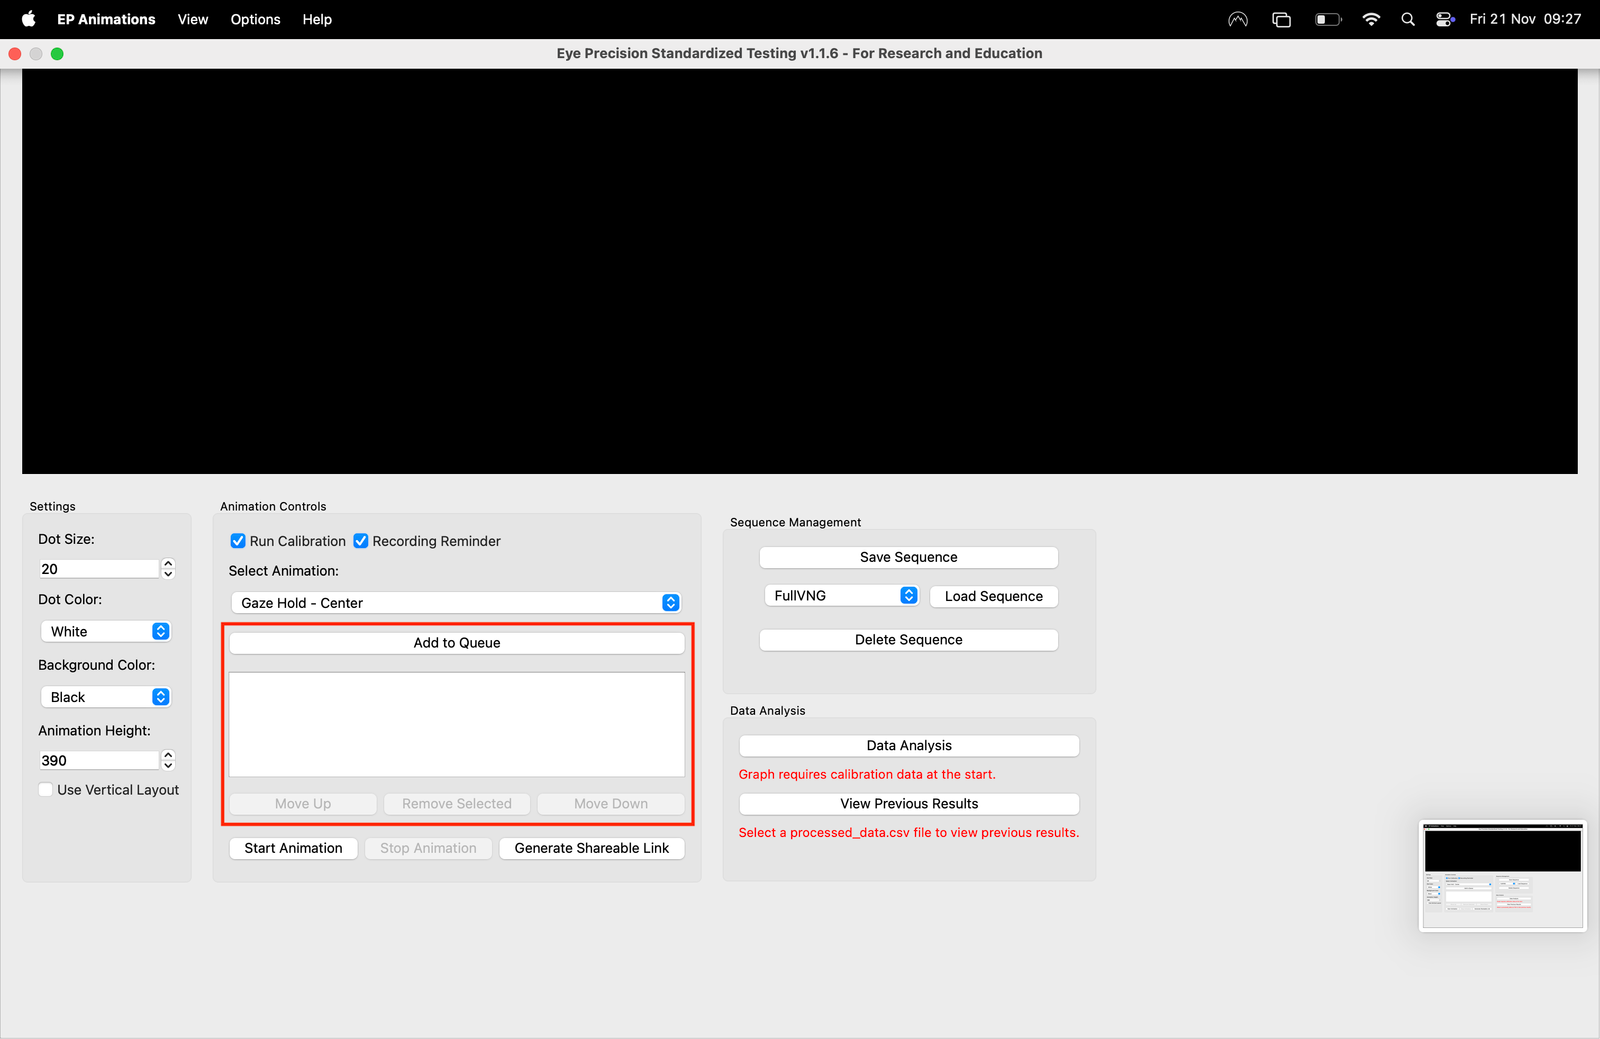
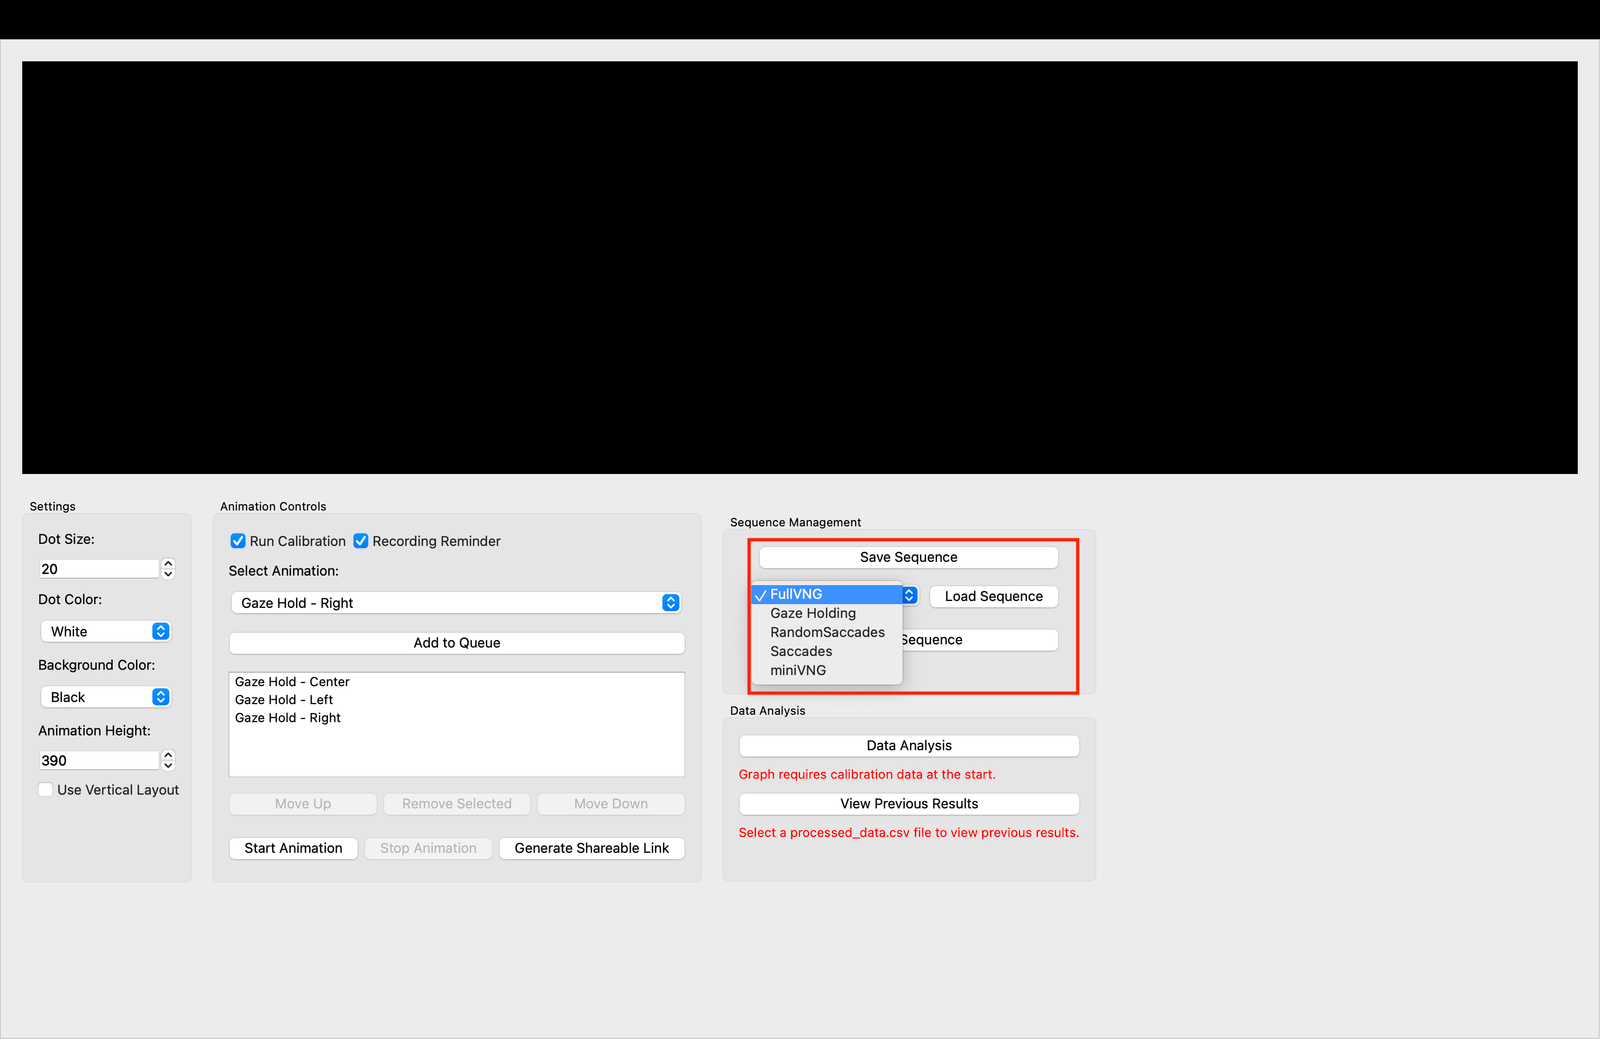
To save a sequence to use again, or to load a previously saved sequence use the sequence settings
The animation queue will be automatically cleared if you switch from vertical to horizontal animations or vice-versa
Optional - Run the animations in the browser
All animations can be run in the browser instead of in the EP Animations window. This allows for remote testing
Set the animation queue as usual, then click on "Generate Shareable Link". A link will then be displayed in a popup, which can then be played in any modern internet browser
The generated link includes instructions for dot colour, background colour etc, and whether to run vertical or horizontal animations
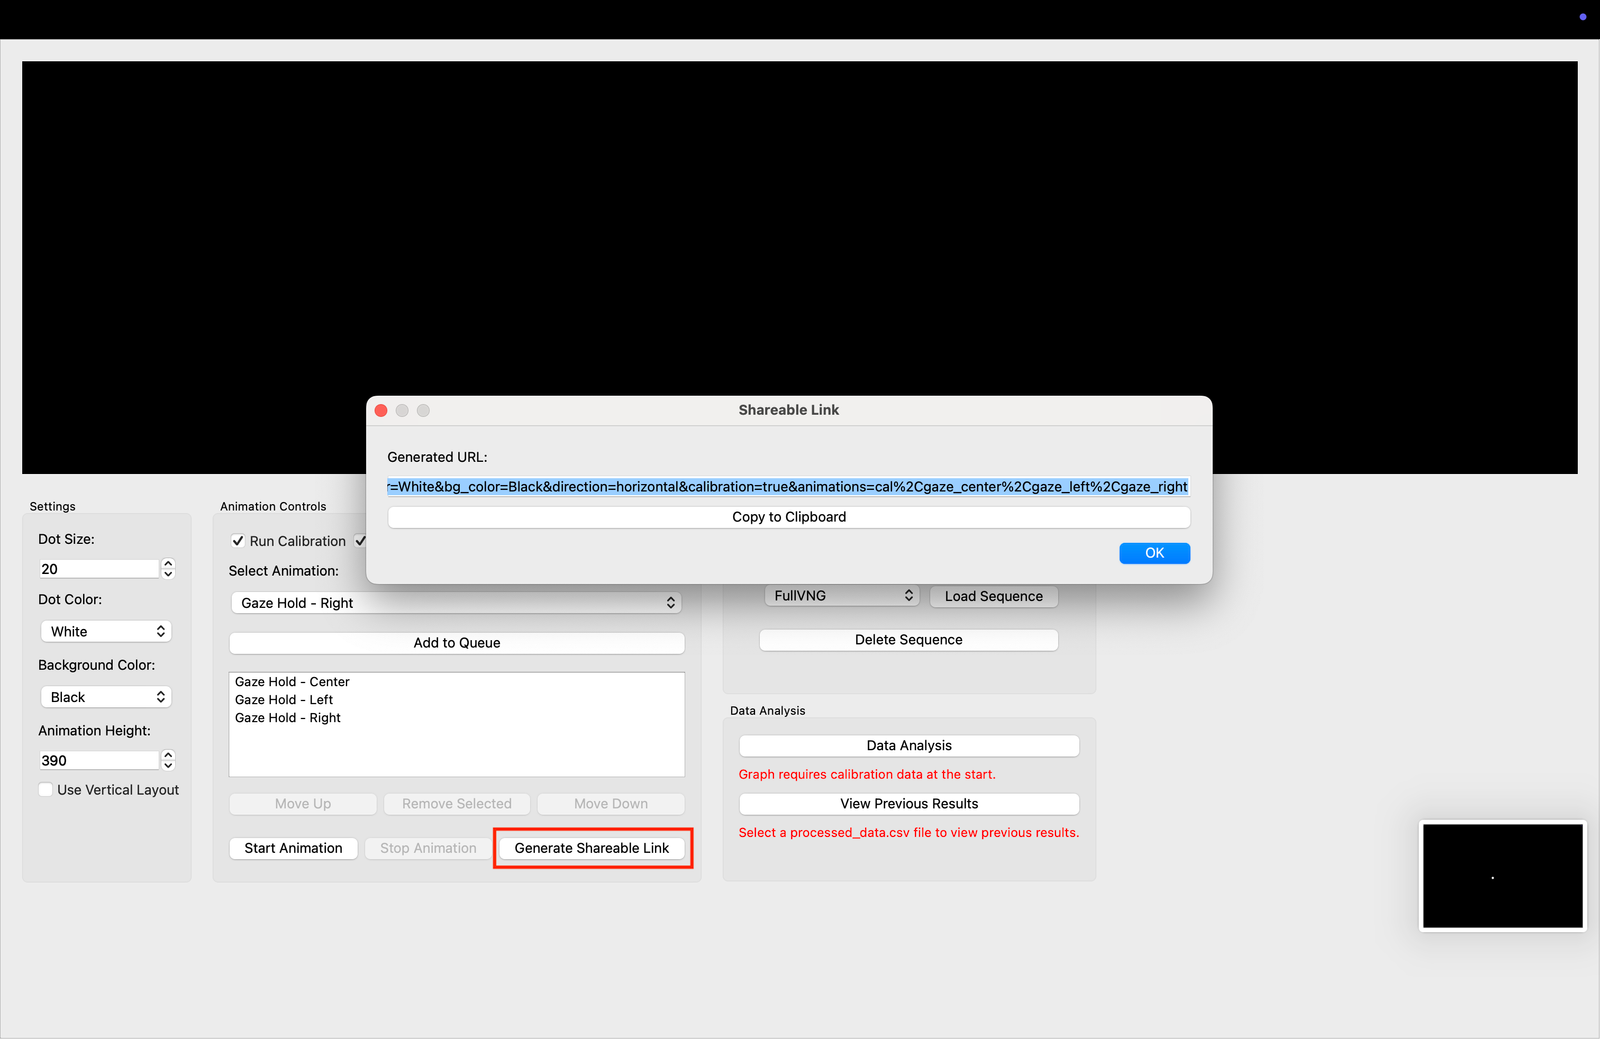
The animations are identical to the animations in EP Animations, so can be used for comparitive graph generation
Test subject positioning
Once all settings are finalised, its time to ensure the test subject is prepared
It is important that the entire width (or height, if performing vertical testing) of the screen is visible to the test subject without them having to move their head. The larger the range-of-motion of the eye, the more useful information may be gathered, so adjust the distance from the screen depending on the screen size
If the test subjects' head moves, the calibration will be less accurate. You may ask your test subject to rest their head in their hands, or you may choose to physically restrain their head yourself
Instructions for recording with a smartphone can be found here
Test subject instructions
It can be useful to describe the tests to the test subject in advance
It is particularly advantageous if the test subject is able to restrict blinking to a minimum
Also advise them to try. ot to move their head or talk
Automatically Stop/Start recording in OBS (v1.1.9+)
For recordings made with OBS studio (including Vesticam goggles), EP Aniamtions can now automatically start and stop recordings
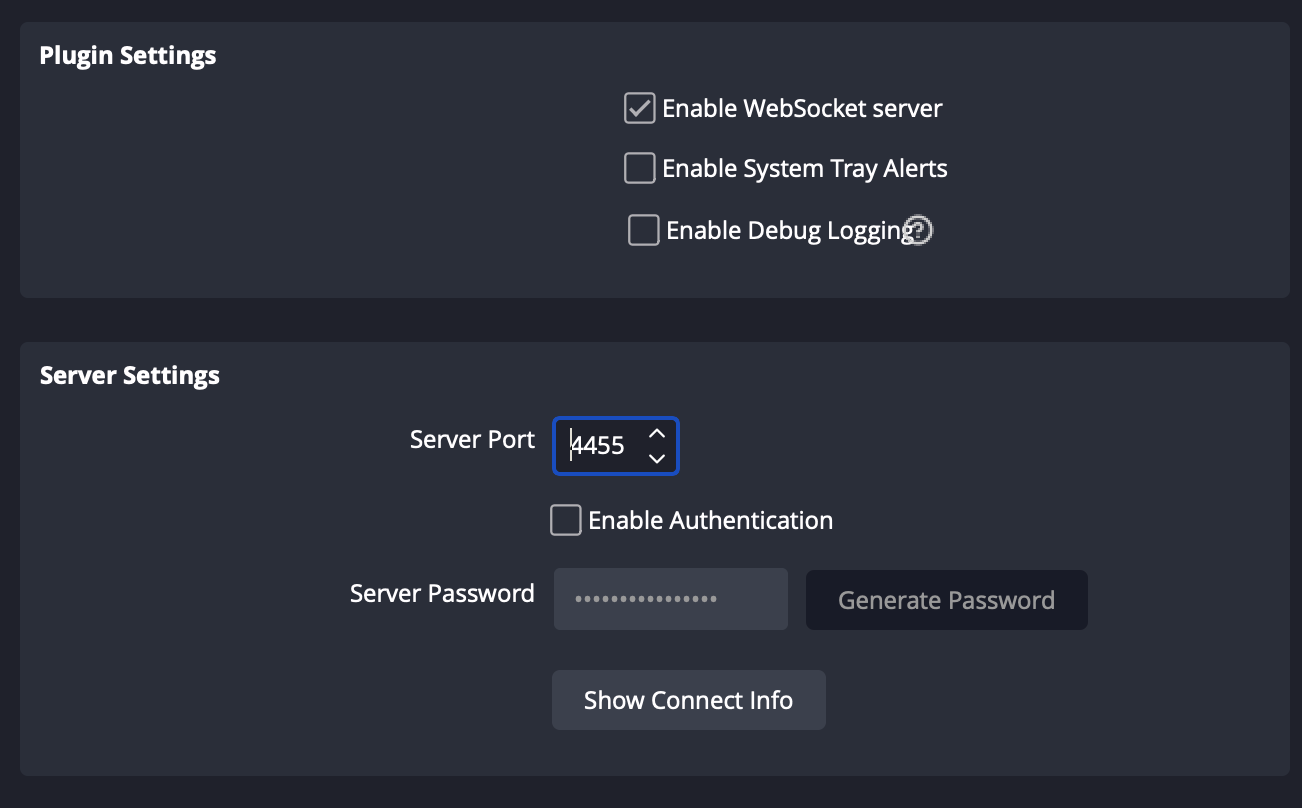
For this function, OBS studio must be running. You can then check the "Auto-Record with OBS" button. This will automatically stop and start recording together with the animations
To do this you need to enable OBS websockets. The is in the OBS studio menu bar. Choose "Tools" > "WebSocket Server Settings", then check "Enable WebSocket Server" and uncheck "Enable Authentication"
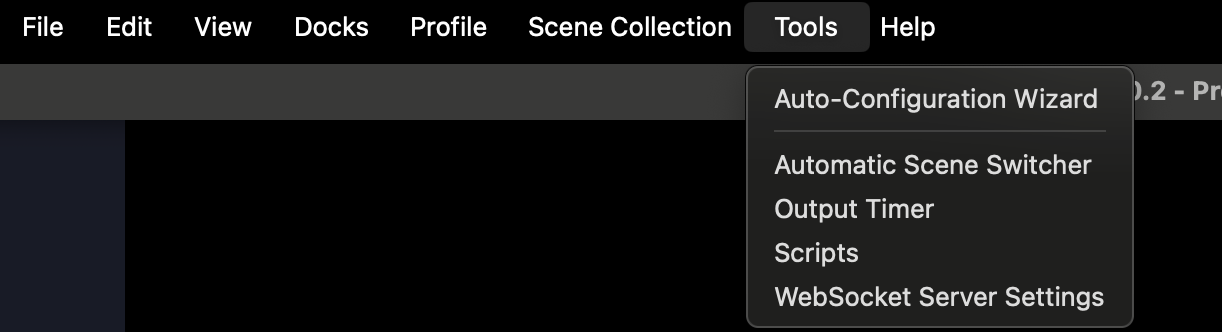
OBS should then record automatically when animations are running
Although in some circumstances OBS can also record from a smartphone, this is not currently recommended
Starting the test
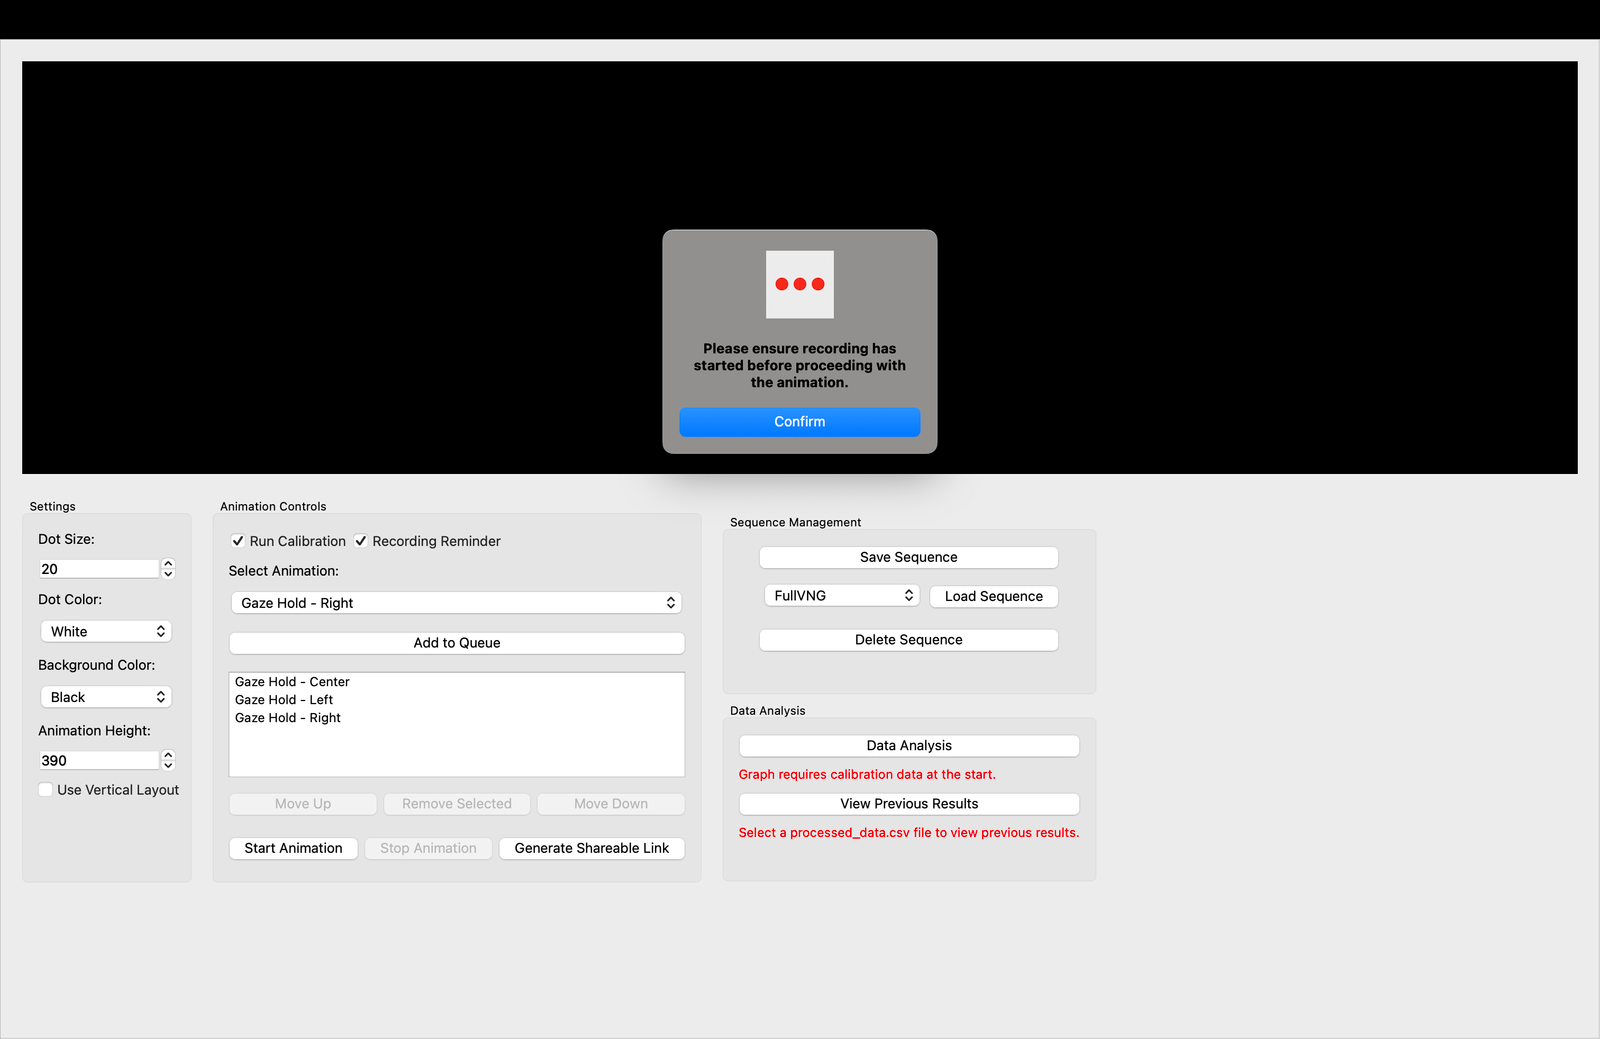
When everything is ready, click "Start Animation"
If the Recording Reminder toggle is on, a popup will appear to try to help you avoid forgetting to record the eye movements - it happens!
Starting the recording is not controlled by EP Animations - it is separate and dependant on your recording device.
Unless you're using OBS after 1.1.9! See above!
As soon as "Start Animation" is clicked (or "Confirm" if using the recording reminder), the first animation will begin
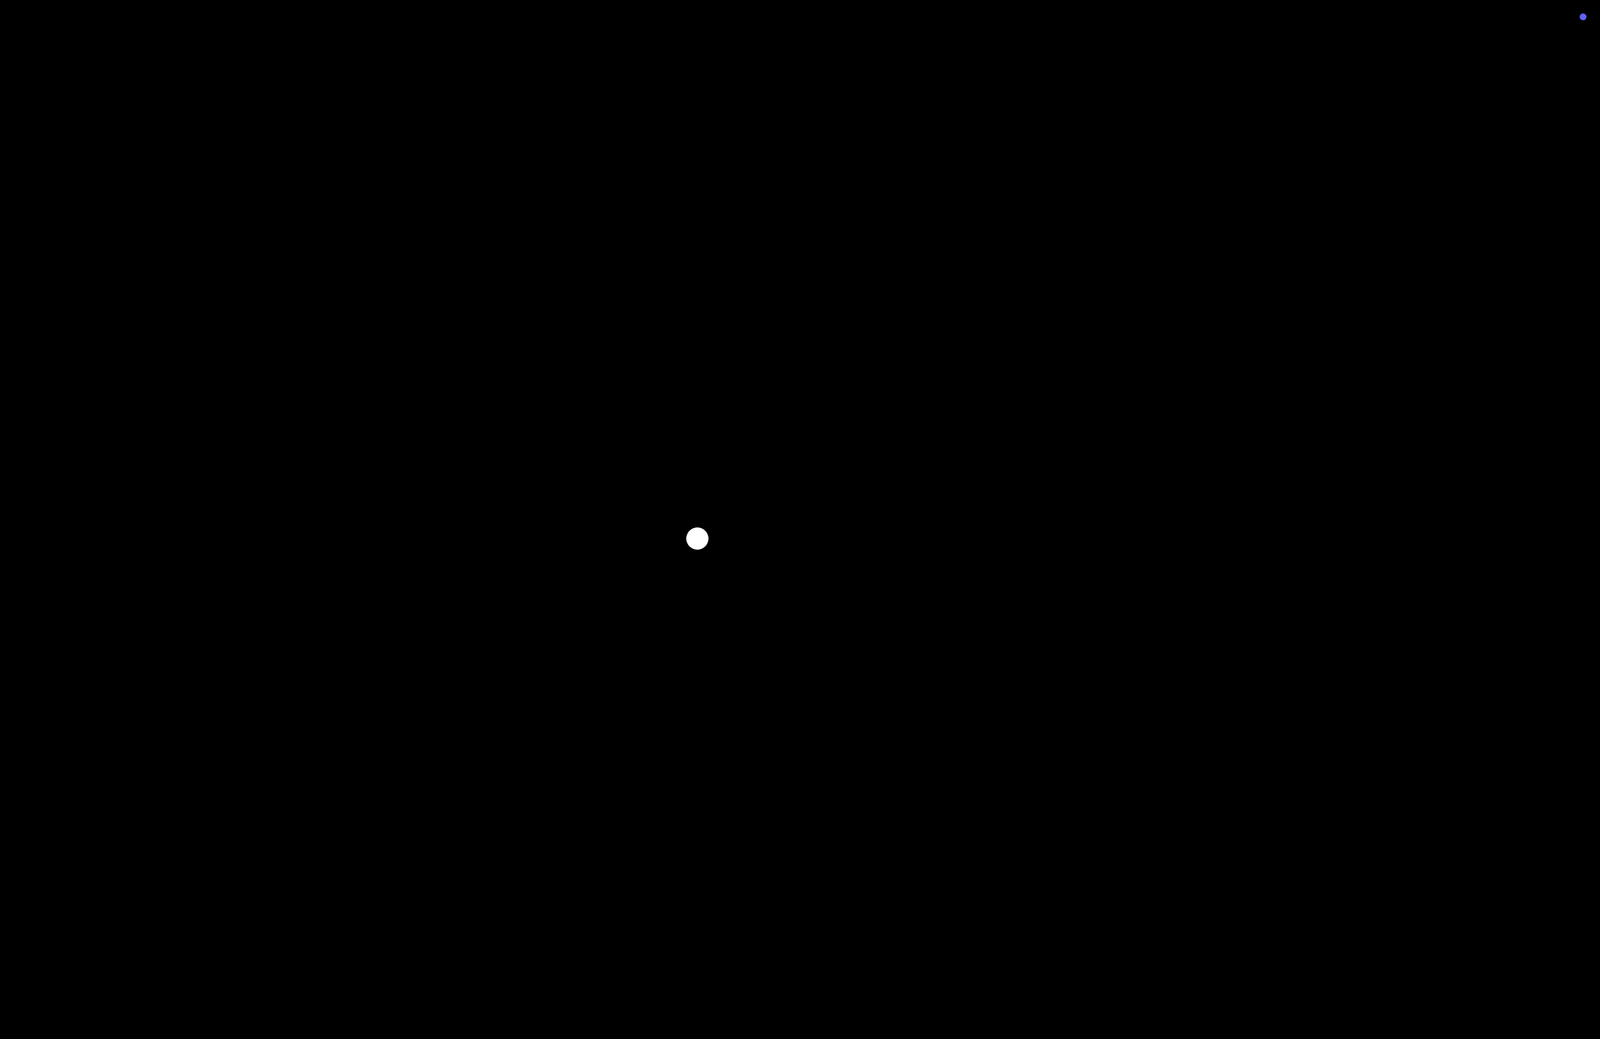
If using full screen animations, you can use the "esc" key on your keyboard to exit at any time
End of the animation
The animation display will stop automatically at the end of the animation queue
Be sure to stop recording once the animations have ended
Processing the recording
The recorded videos are processed in the main Eye Precision app
For help transferring videos recorded on smartphone to your computer go to this learning module
Follow this step-by-step guide to learn how to process the video
Data Analysis
Once the video has been processed, the EP Aniamtions app can use the data to generate comparitive graphs, as long as a calibration phase is included in the recorded video
Eye Precision v1.4.4+ and Animations v1.1.9+ - Automatically open Data Analysis from Results in Eye Precision
From Eye Precision v1.4.4 and EP Animations v1.1.9, you can automatically open the results file in EP Animations by clicking the "Analyse in EP Animations" button at the bottom right of the results screen. This button is only visible if EP Animations is installed on you computer
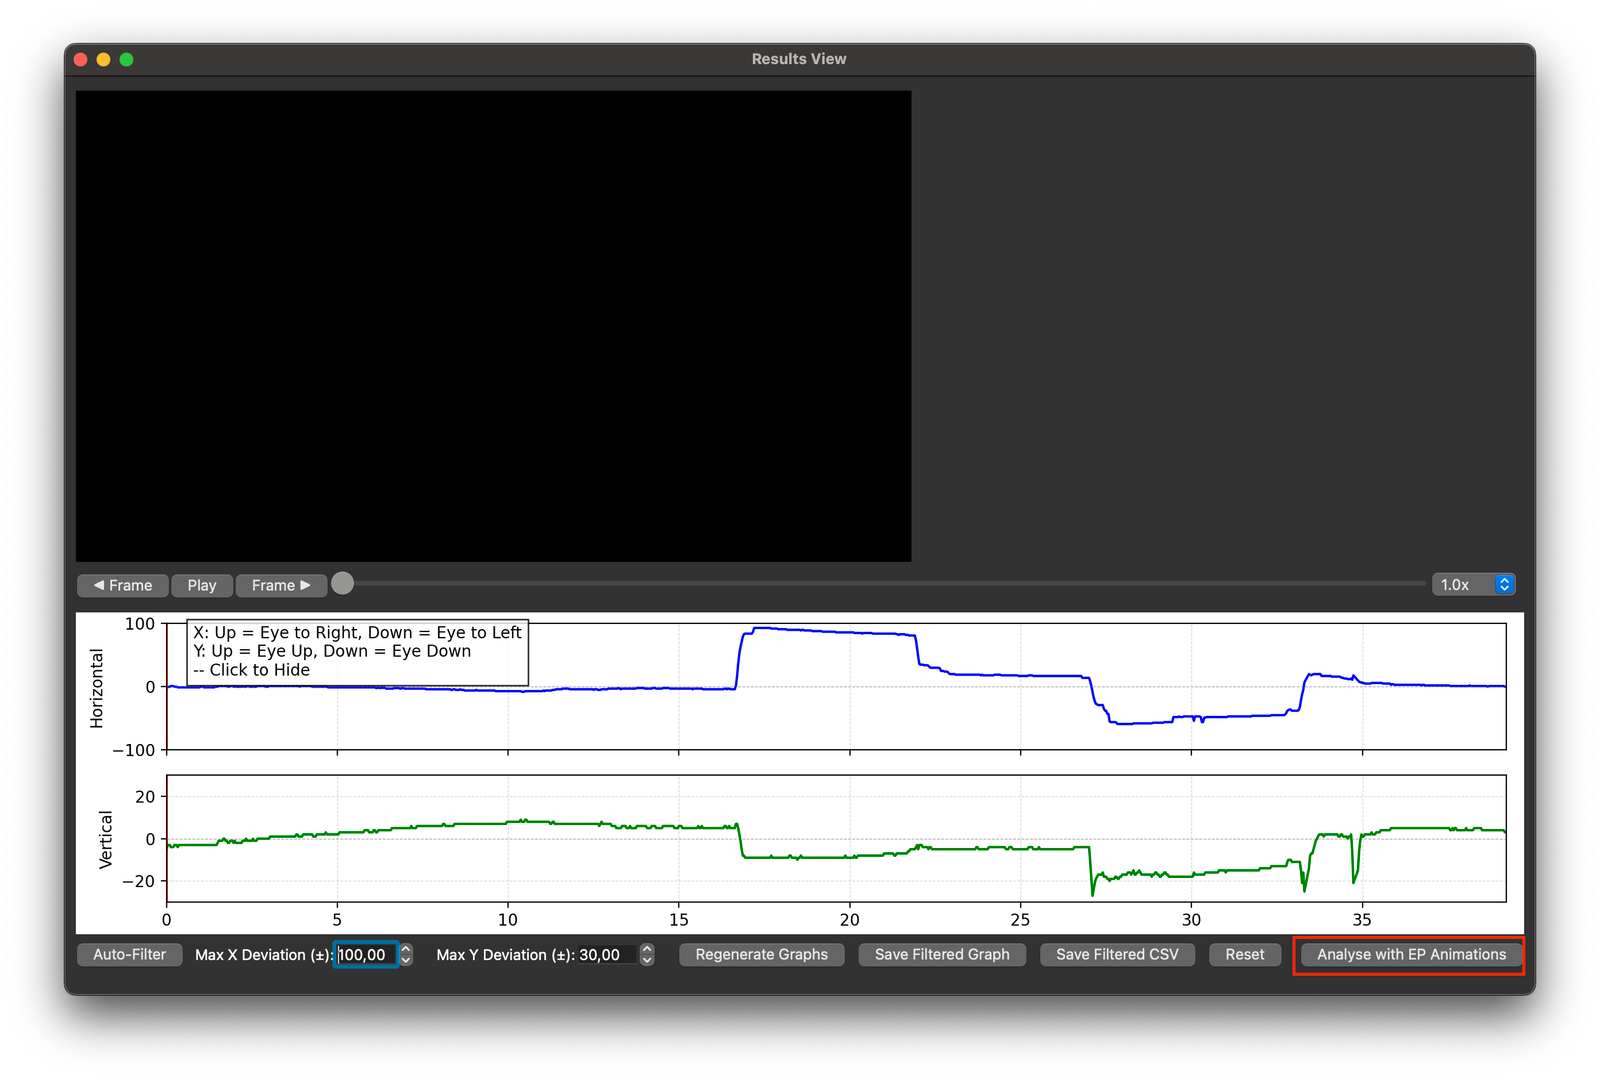
Please be patient after clicking the button, depending on your computer it may take a minute to launch EP Animations. Make sure to navigate to EP Animation, as the window won't appear on top on its own
If EP Animations is installed but the button doesn't show in your results view, make sure that you're running Eye Precision v1.4.4 or higher (displayed in the bar at the top of the window or screen). If it still doesn't show, you can manually tell Eye Precision where to find EP Animations under "Advanced Settings" in the menu bar
Older versions (please update!) - Return to EP Animation and click on "Data Analysis"
This will take you through to the Data Analysis window. The animation queue will be noted and transferred to the new window
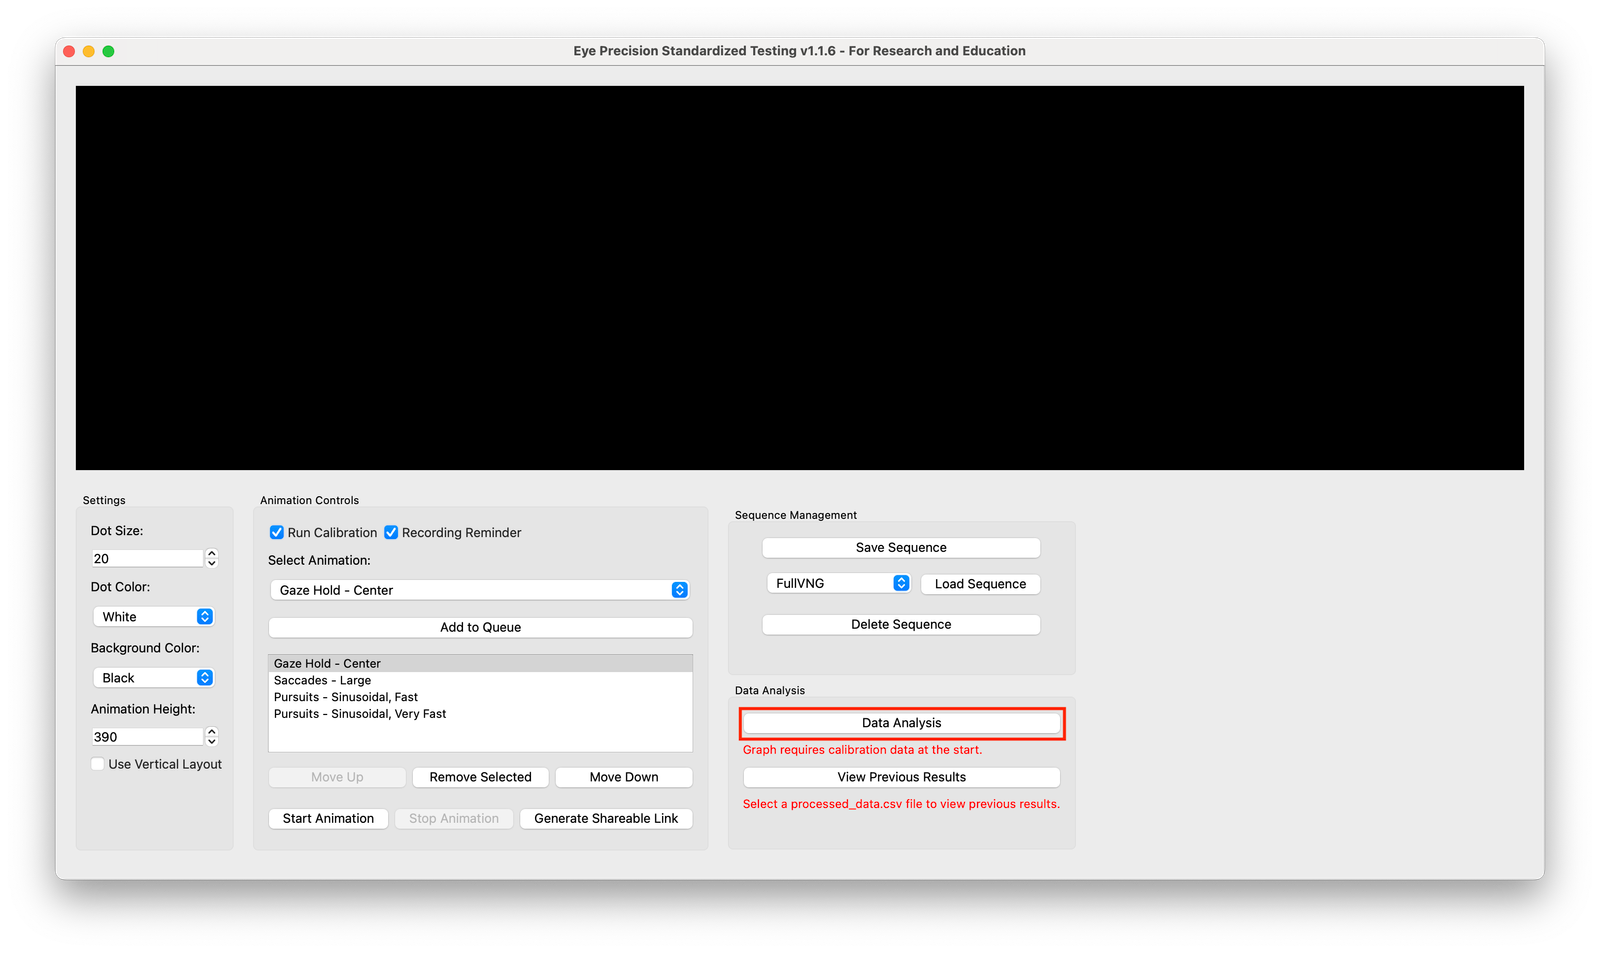
Check Comparison List
The Animation Queue from the main window should be transferred over to the Comparison Queue at the top of the new window. Check that all items match, and add/remove/adjust as necessary. Also confirm that the correct orientation is selected (Horizontal or Vertical) in the checkbox
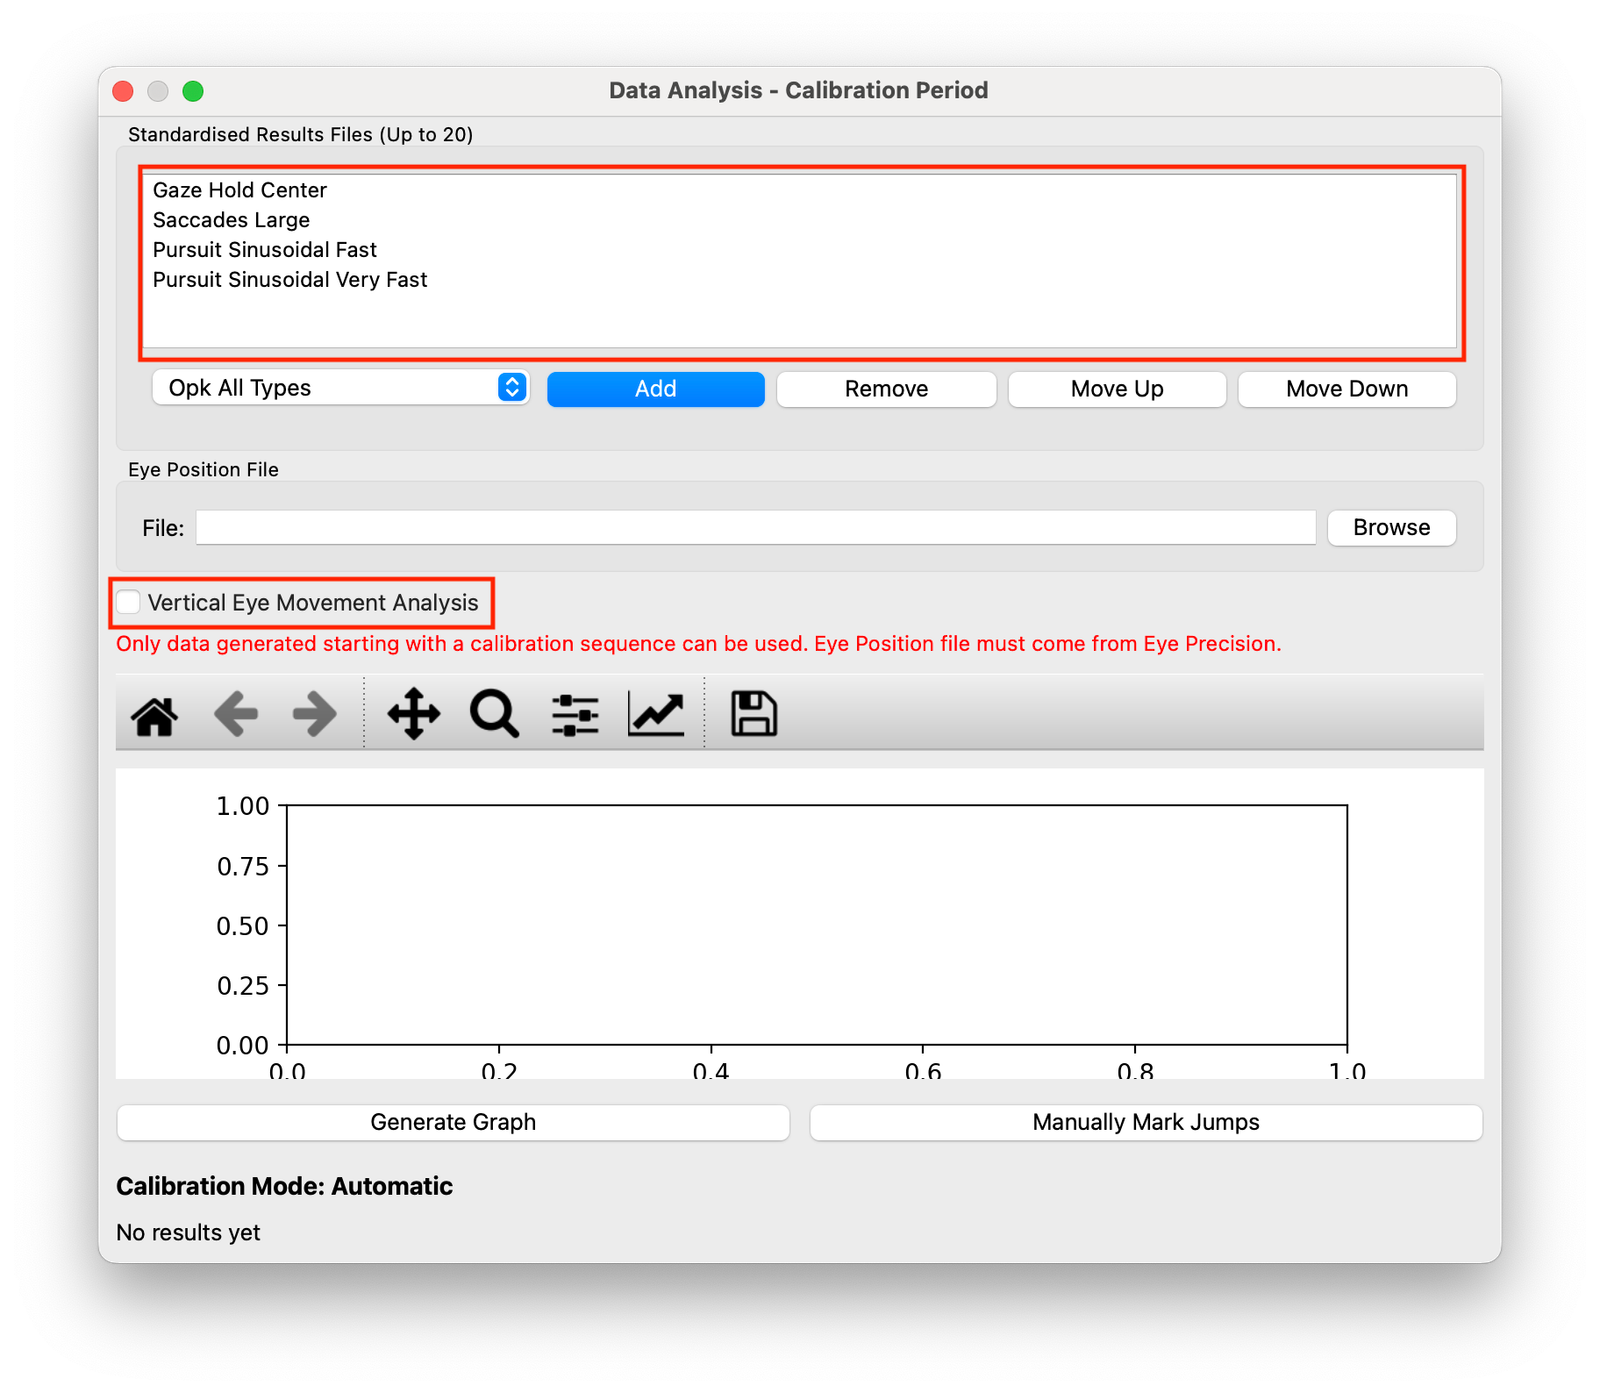
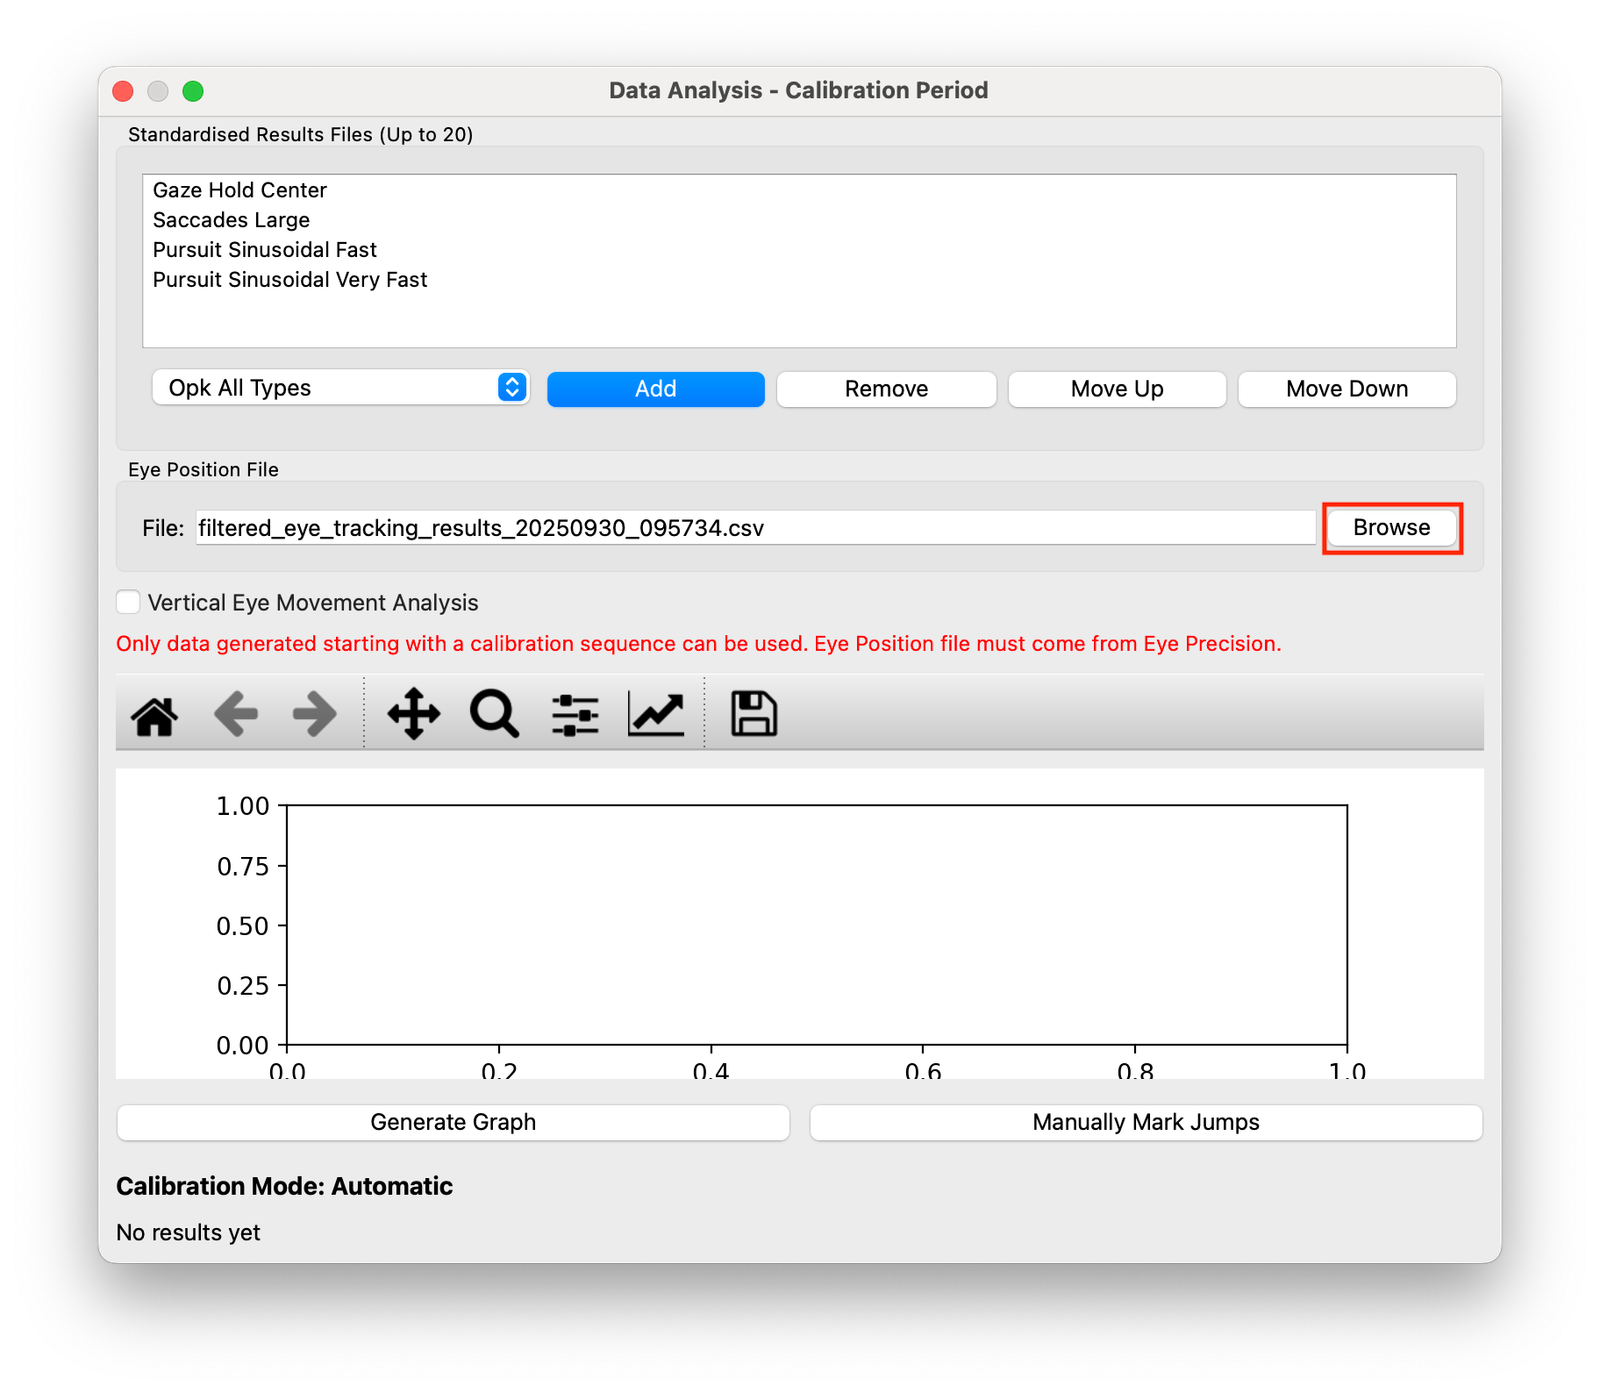
Load Results file
Click on "Browse" and select the eye_tracking_output.csv or filtered_eye_tracking_results______.csv file that you want to analyse. These should be in the output directory that you selected in Eye Precision, and then in a directory that is named "tracking_" followed by the date and time by default. You may rename these files and directories at any time
Generate Graph with Auto-Calibration
When you've selected your comparisons and your results file, click on the "Generate Graph" button
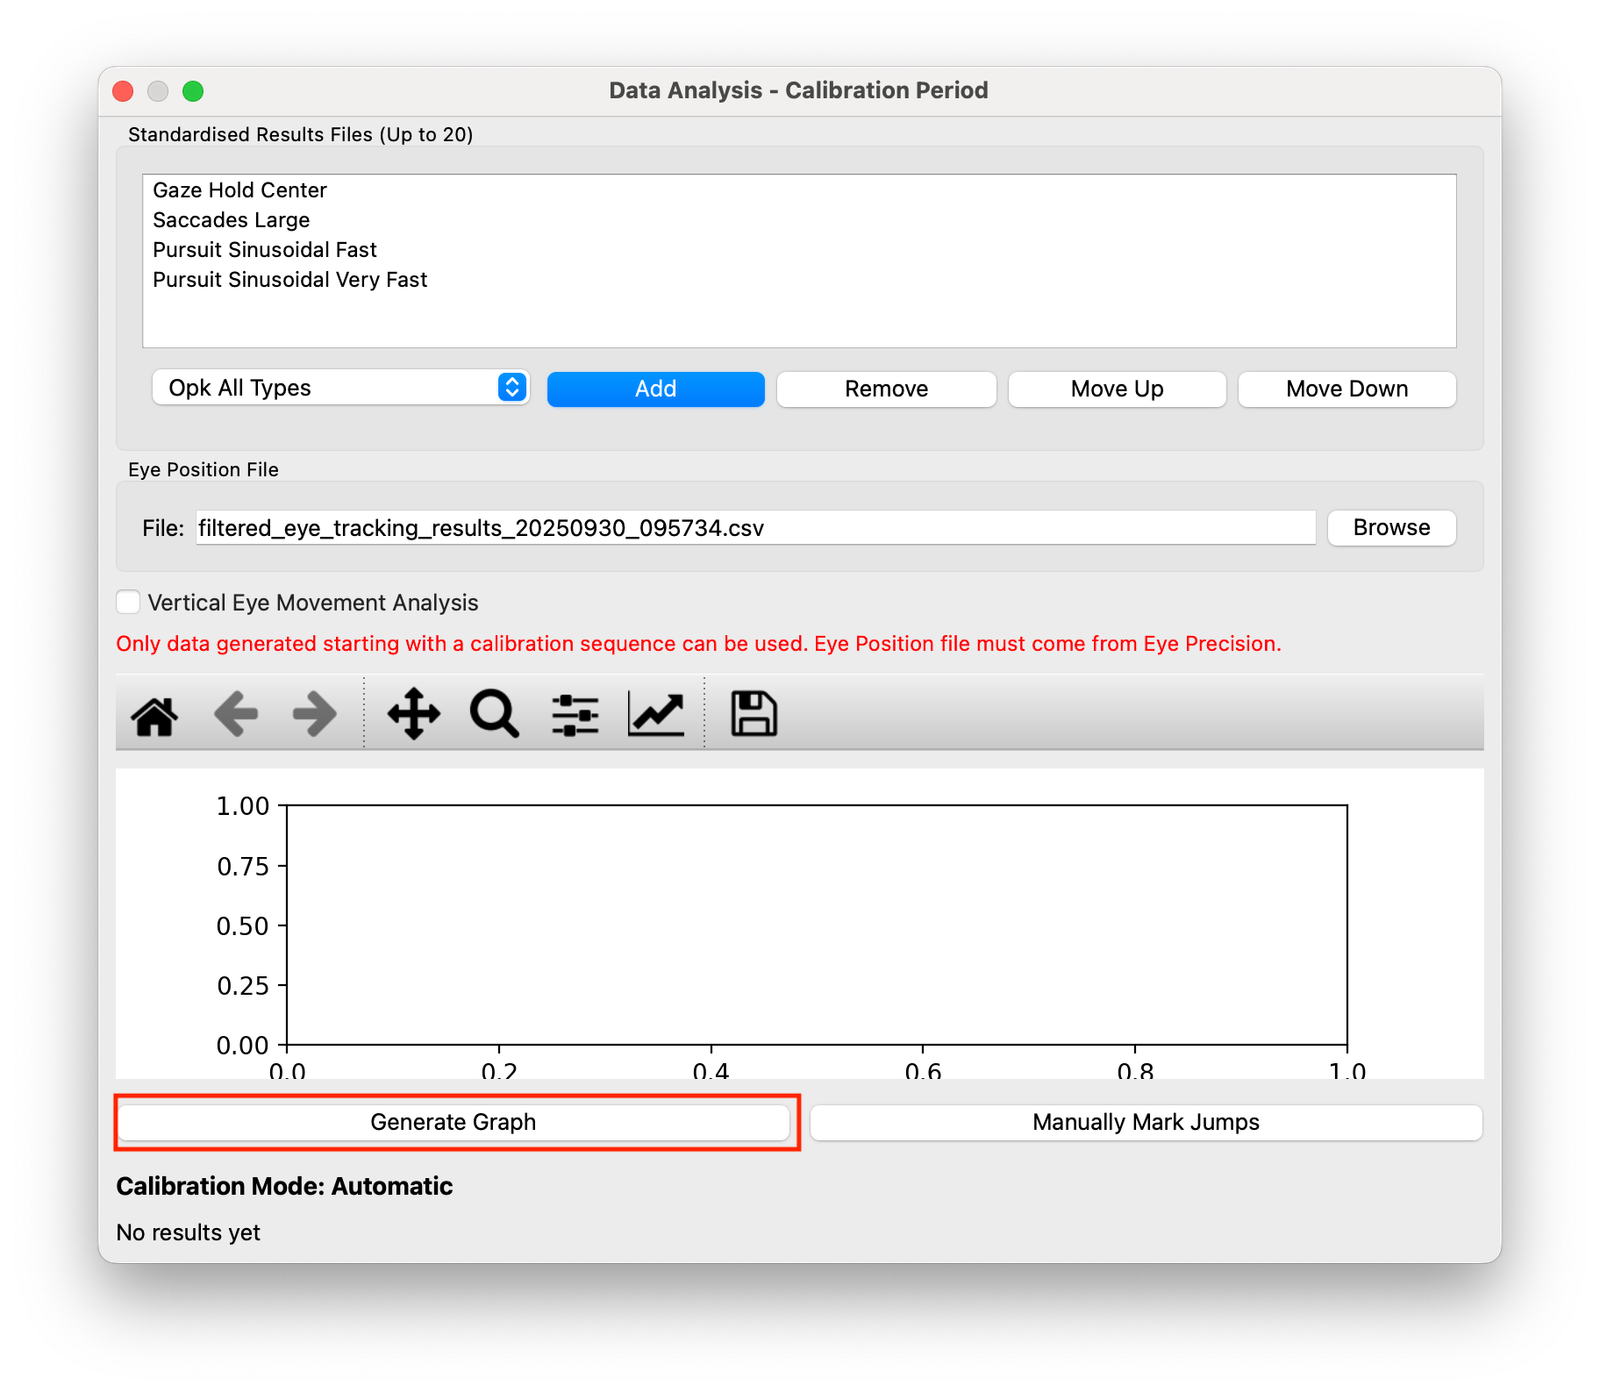
The program will attempt to find the calibration points in the results automatically, and will display a results graph
If there are artifacts in the calibration phase, or the timing is off, it may be necessary to manually calibrate the results. Go to the next section to learn this process
Manual Calibration
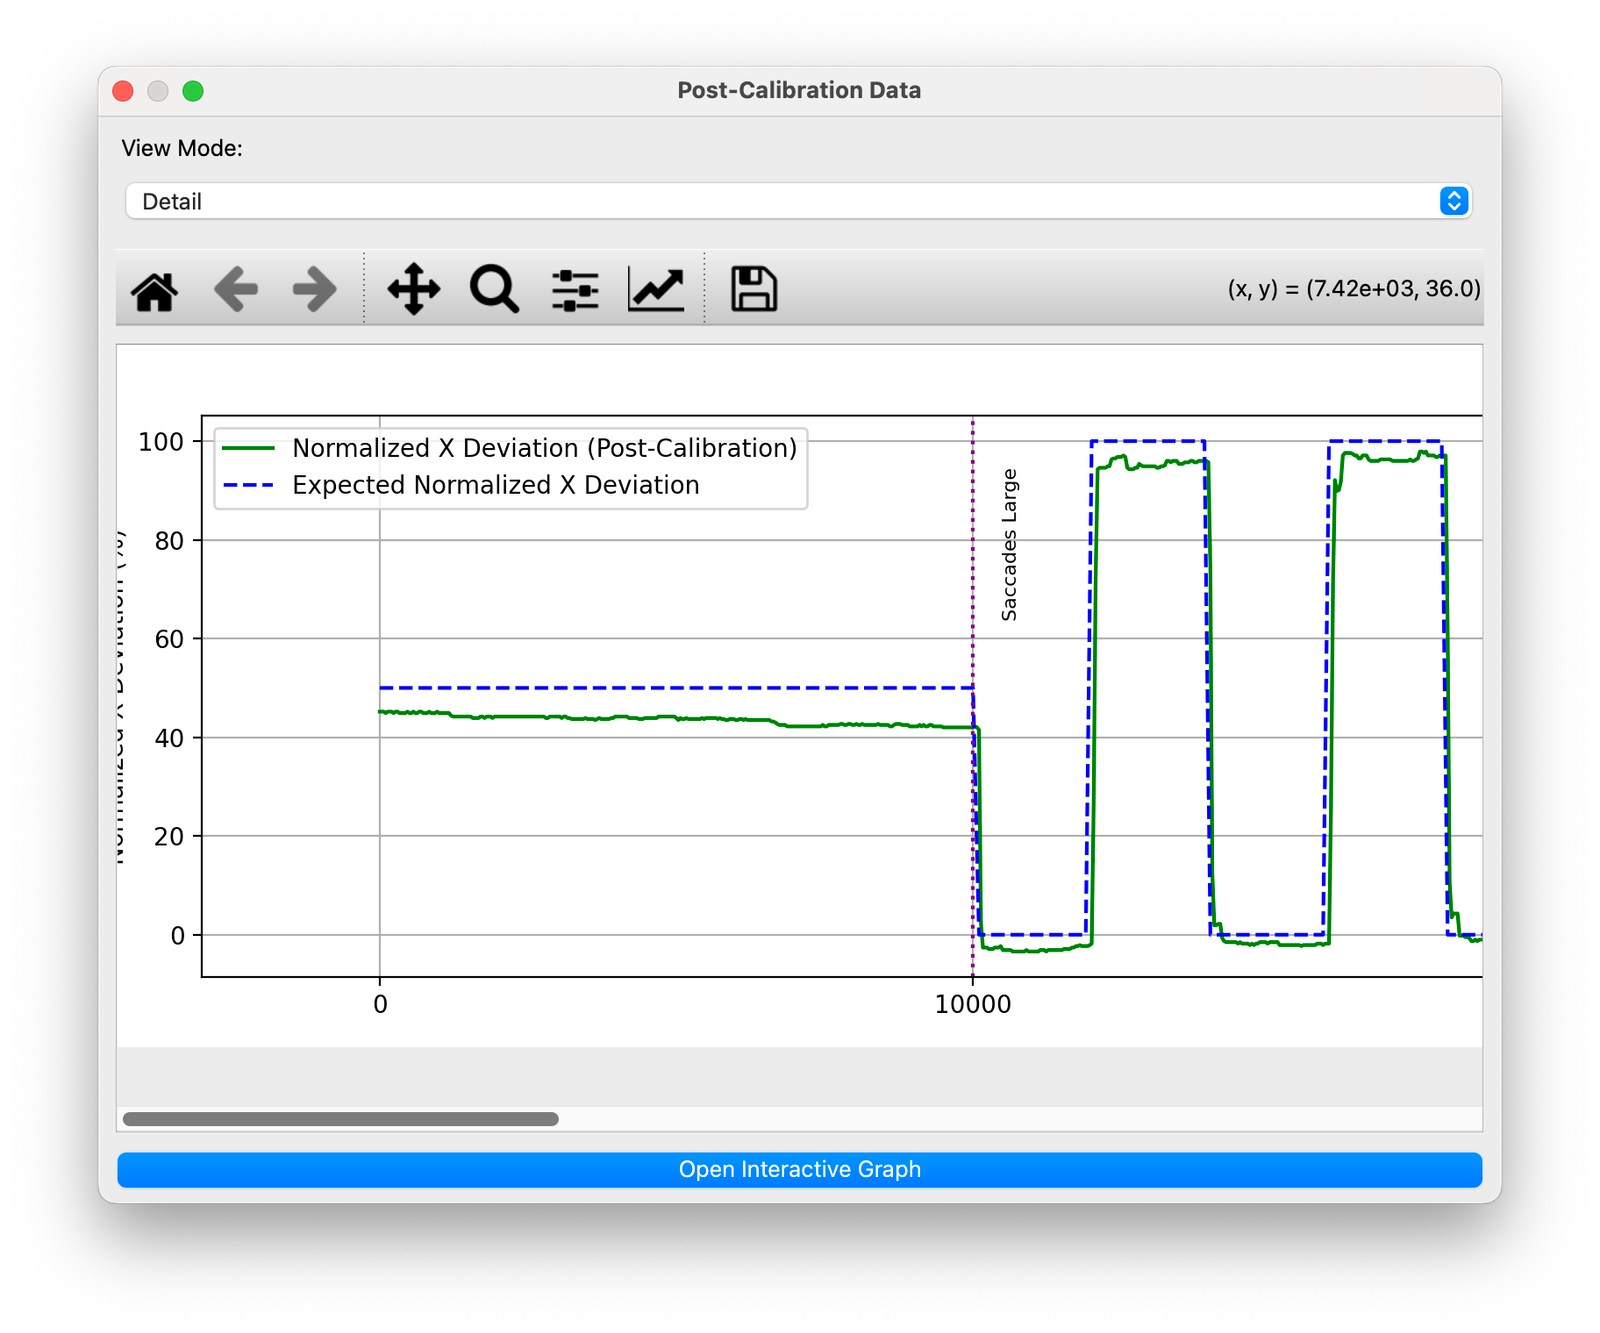
If the automatic calibration has succesfully found the saccades of the calibration phase and the graph lines up reasonably with the expected results line, you can skip this step
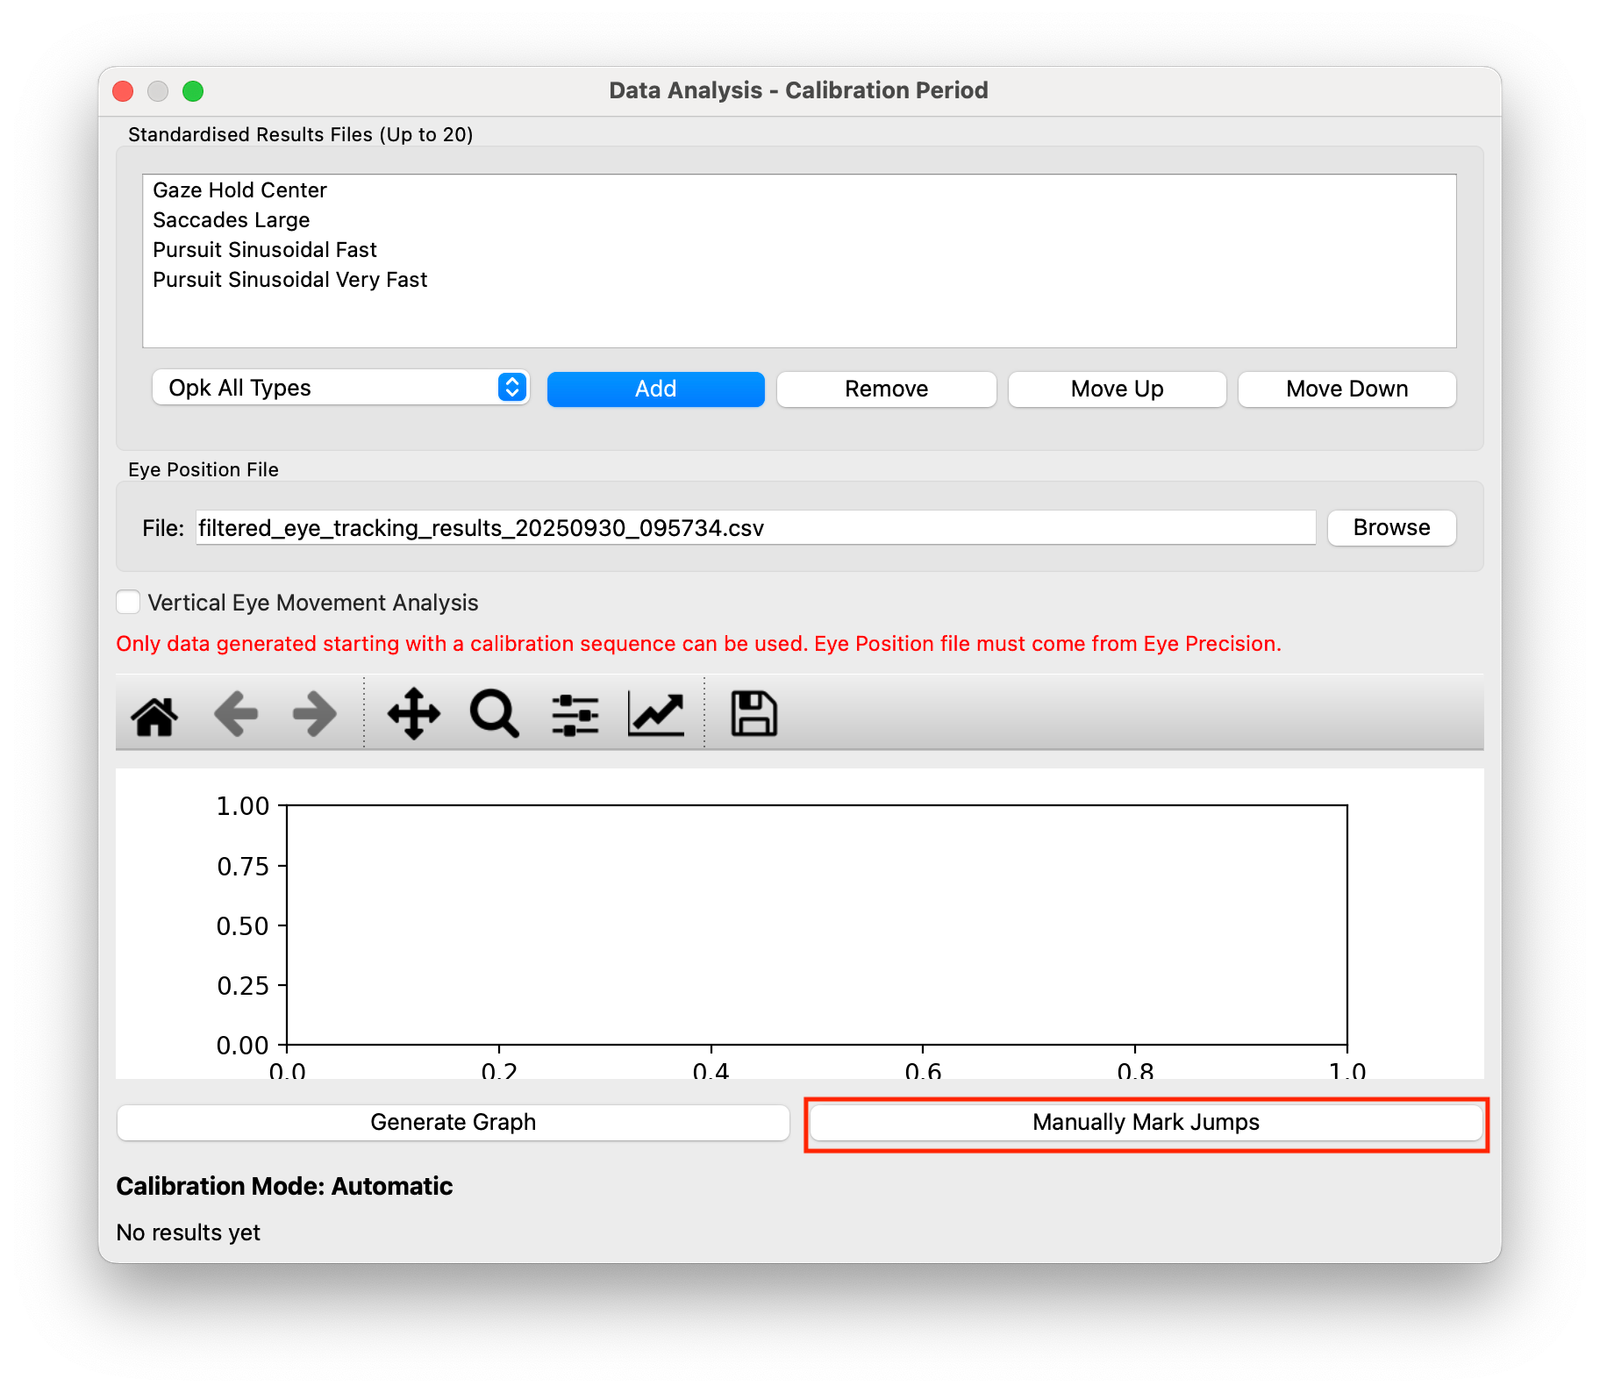
Close the results window and return to the previous window, then click on "Manually Mark Jumps"
A new window will open, displaying a graph of the first 40 seconds of the results file. A calibration phase should contain fours saccades, visible as 4 vertical lines on the graph
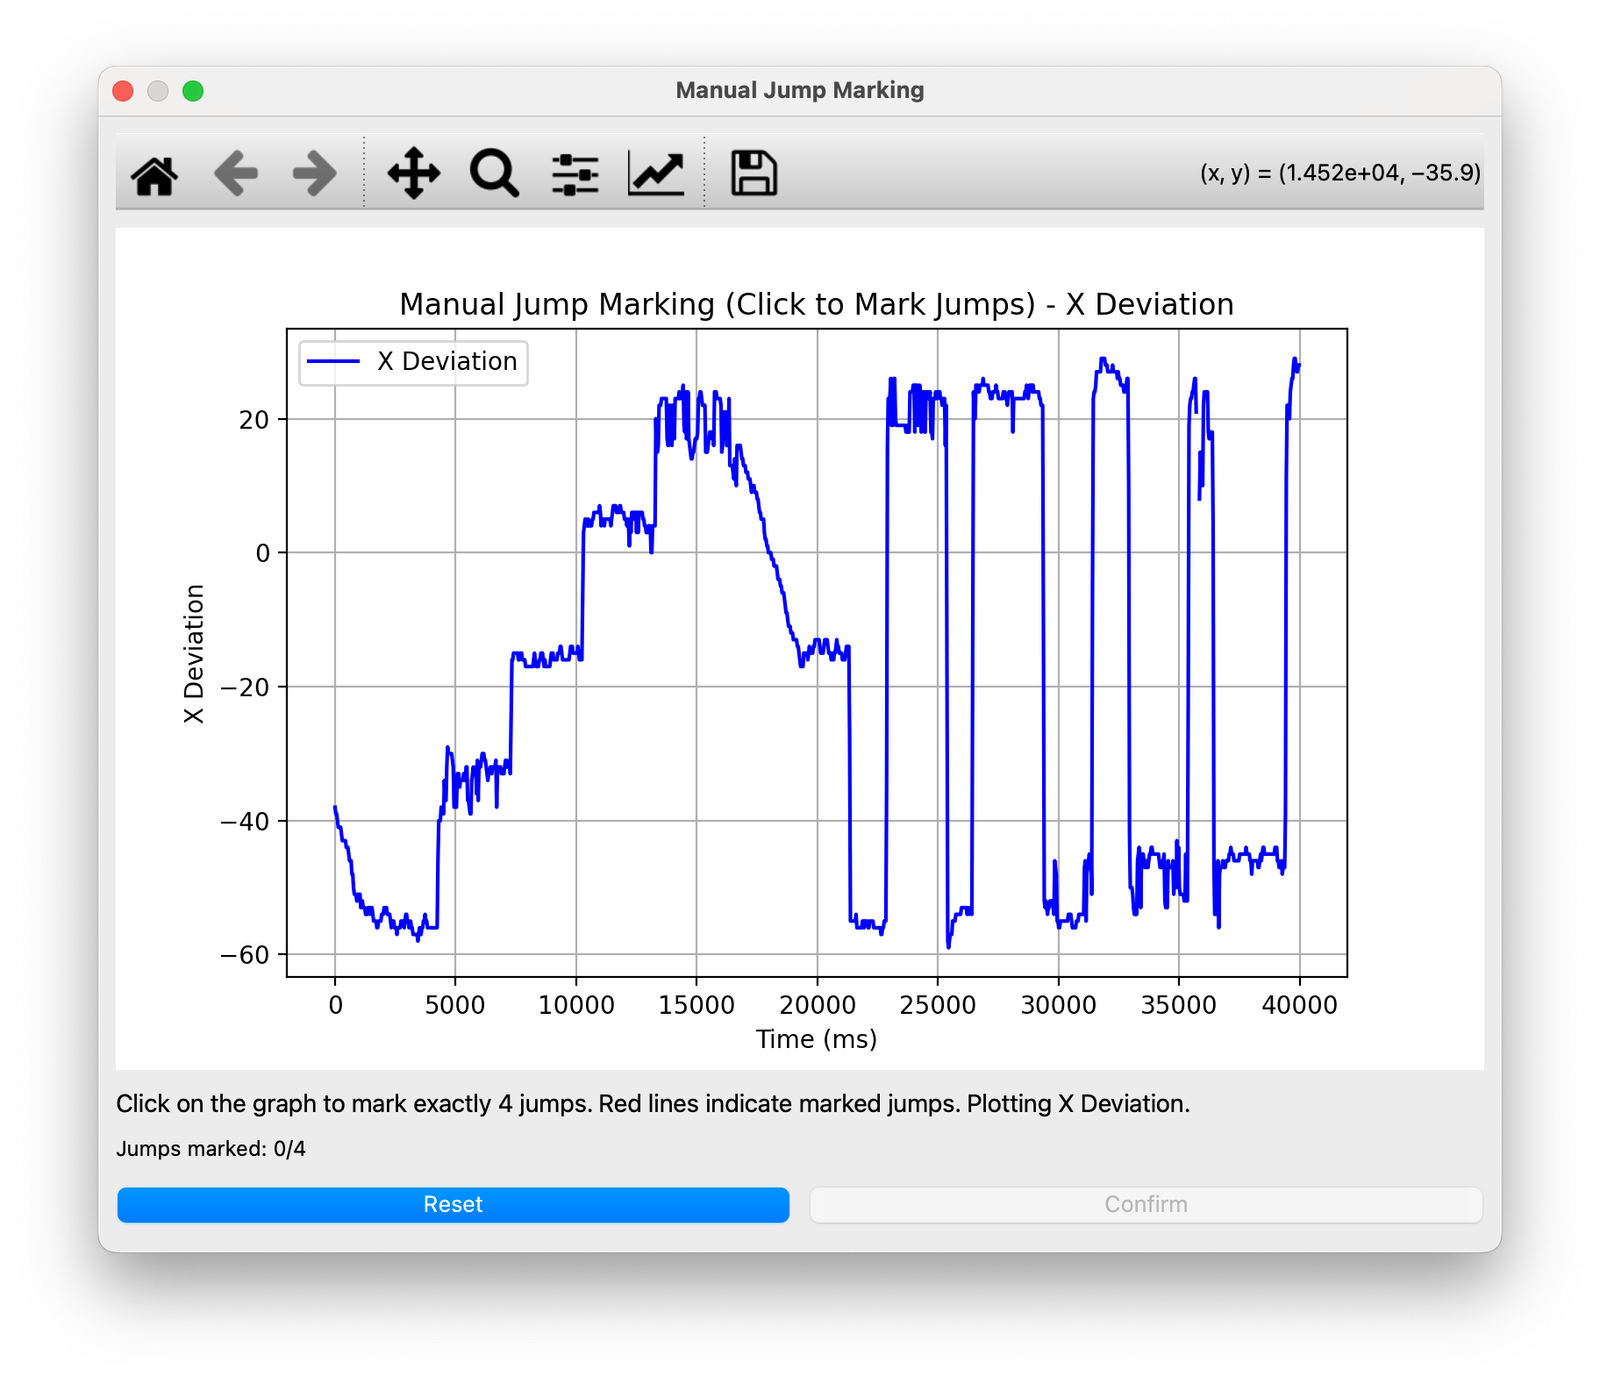
Click on each of the four saccade lines in turn to mark their positions. After marking the fourth saccade, click confirm and the program will display a pop-up. Confirm this popup and the program will return to the previous window
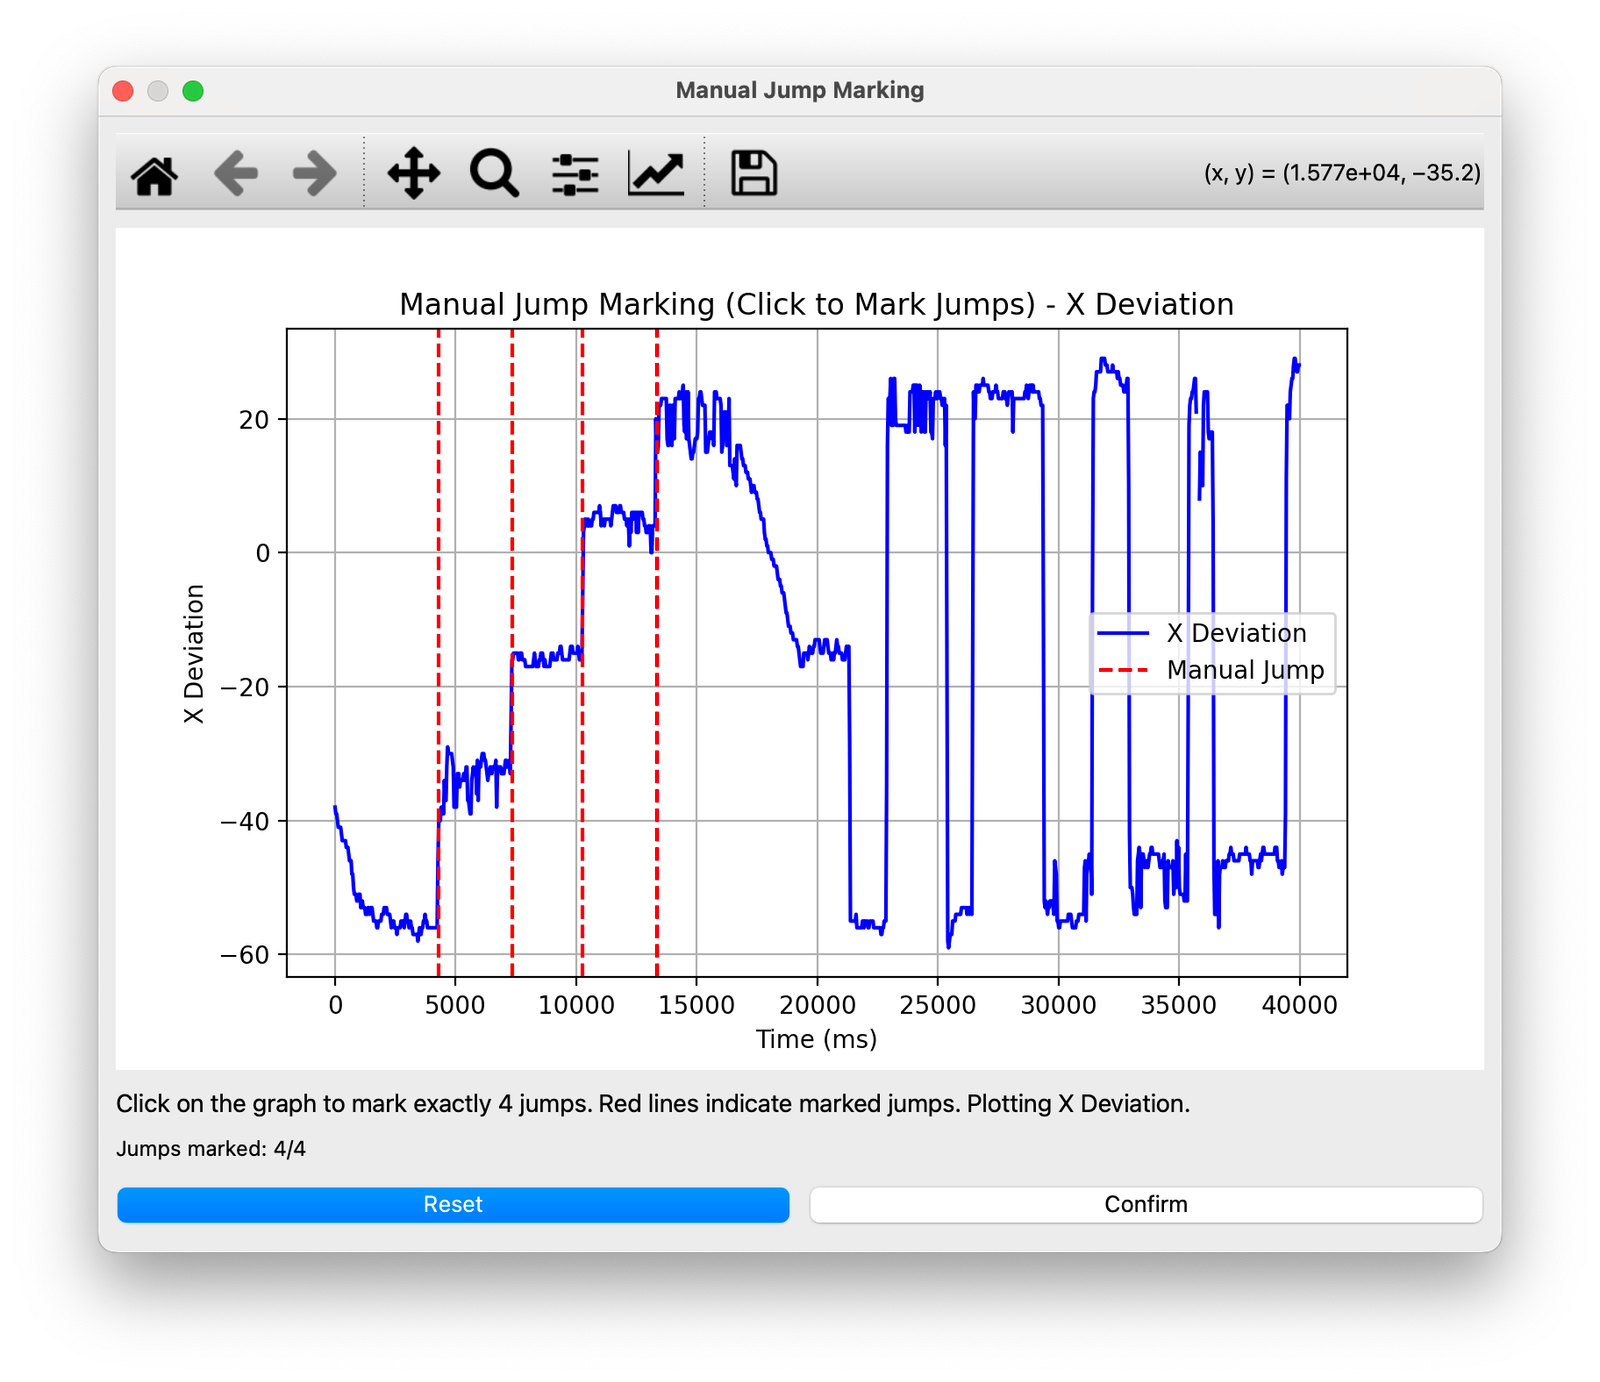
In the even that you misclick and don't accurately click on a saccade, click on "Reset" and re-mark the four saccades
Once the saccades have been marked, click on "Generate Graph" again to display the results graph with the manual calibration applied
Open the interactive graph
The best view of the results data is in the interactive graph. You can open this from the results view by clicking the "Open Interactive Graph" button. This will open the graph in your browser. It may first ask for confirmation
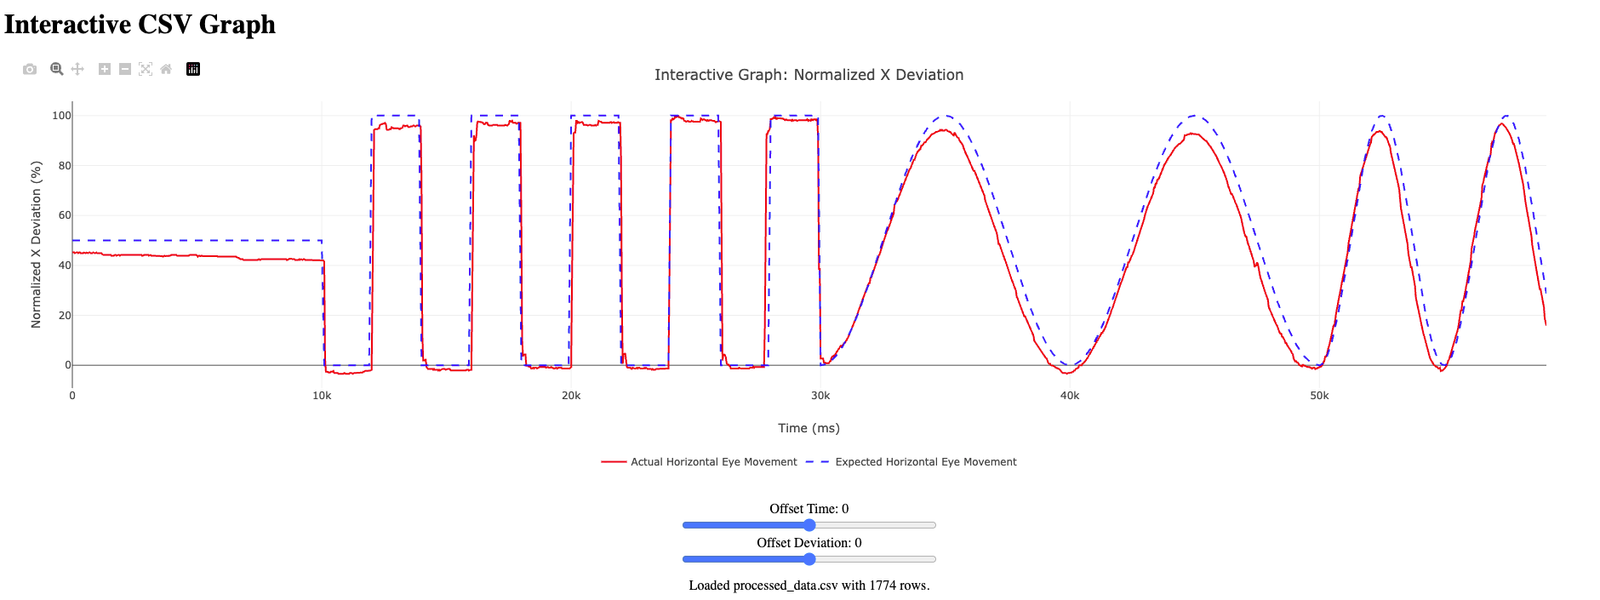
To understand and use the interactive graphs, go to this module