Built-in graphs in Eye Precision
The graphs displayed by default in Eye Precision are simple plots of X deviation and Y deviation against time.
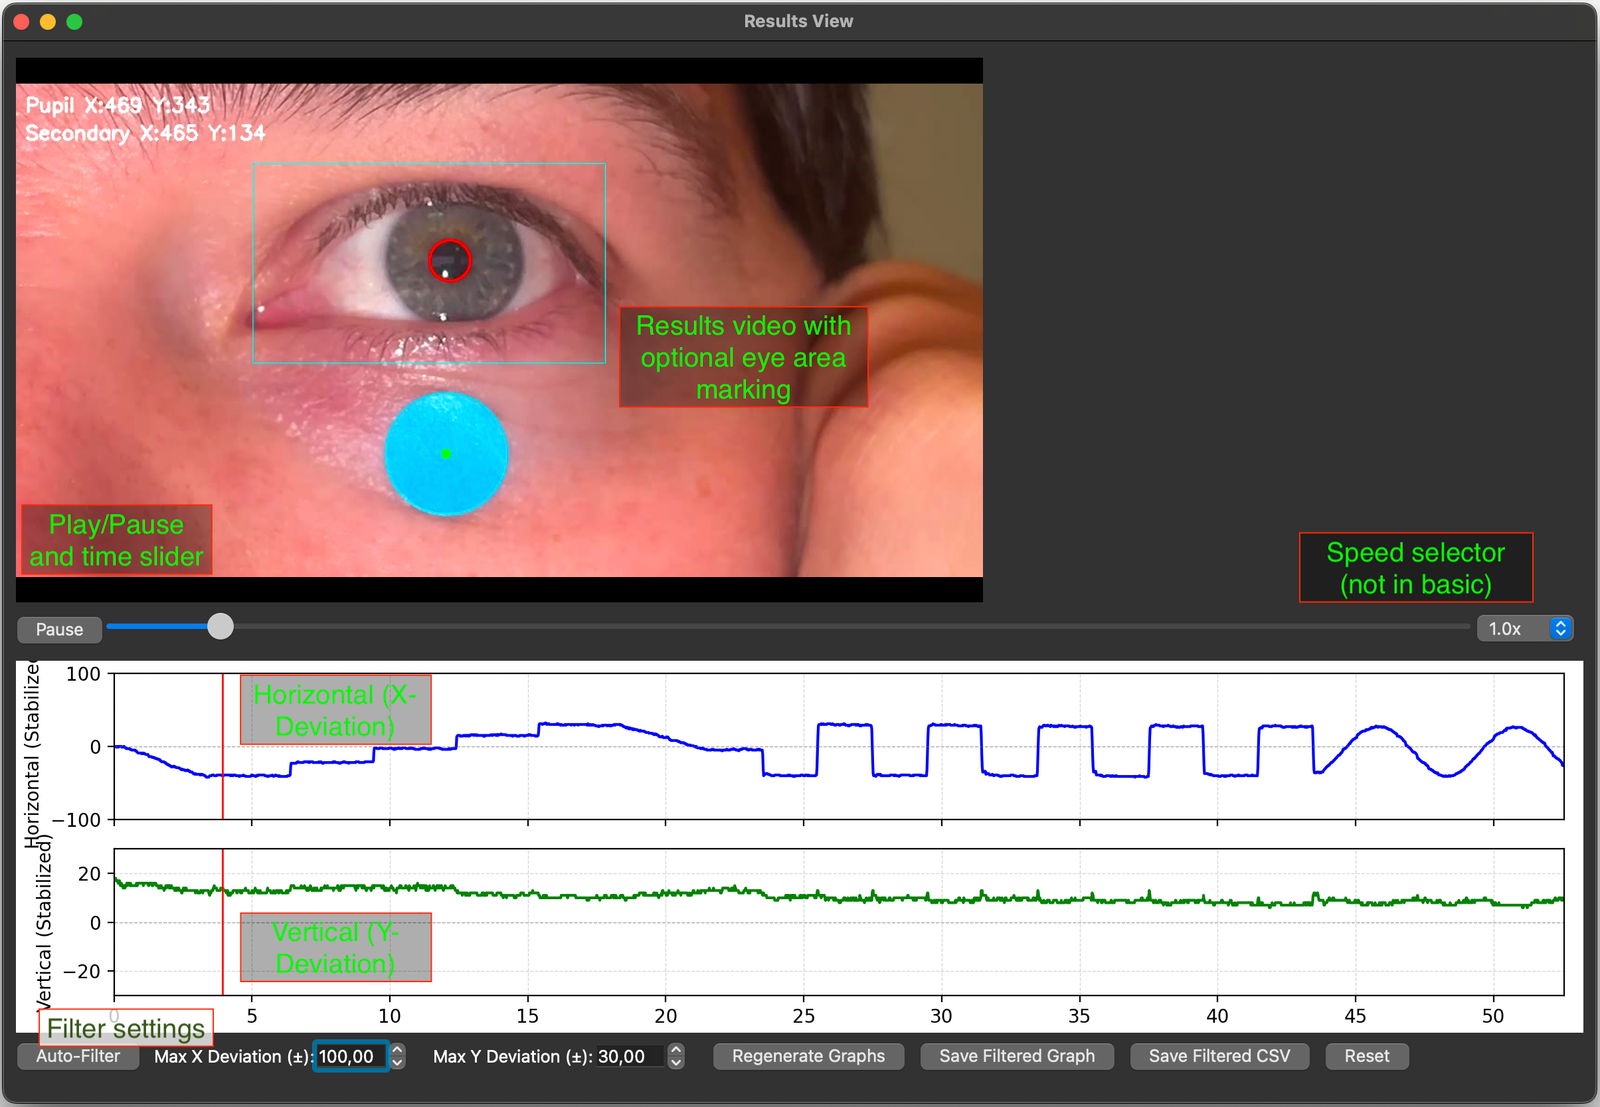
Horizontal deviation is shown on the top graph - an upward line is a leftward movement on the video - note, this will usually be a rightward eye movement
Vertical deviation is shown on the second plot
While the video plays, a marker displays the current time on both graphs
Graphs can be filtered to remove artifacts such as blink. The auto-filter removes anything outside of a set threshold, or you can fine-tune the filtering using the selectors at the bottom of the results screen
The filtered graph and/or CSV data file can be saved for use in EP Animations or other applications